HSBC 2010 Annual Report Download - page 285
Download and view the complete annual report
Please find page 285 of the 2010 HSBC annual report below. You can navigate through the pages in the report by either clicking on the pages listed below, or by using the keyword search tool below to find specific information within the annual report.-
 1
1 -
2
-
3
-
4
-
5
-
6
-
7
-
8
-
9
-
10
-
11
-
12
-
13
-
14
-
15
-
16
-
17
-
18
-
19
-
20
-
21
-
22
-
23
-
24
-
25
-
26
-
27
-
28
-
29
-
30
-
31
-
32
-
33
-
34
-
35
-
36
-
37
-
38
-
39
-
40
-
41
-
42
-
43
-
44
-
45
-
46
-
47
-
48
-
49
-
50
-
51
-
52
-
53
-
54
-
55
-
56
-
57
-
58
-
59
-
60
-
61
-
62
-
63
-
64
-
65
-
66
-
67
-
68
-
69
-
70
-
71
-
72
-
73
-
74
-
75
-
76
-
77
-
78
-
79
-
80
-
81
-
82
-
83
-
84
-
85
-
86
-
87
-
88
-
89
-
90
-
91
-
92
-
93
-
94
-
95
-
96
-
97
-
98
-
99
-
100
-
101
-
102
-
103
-
104
-
105
-
106
-
107
-
108
-
109
-
110
-
111
-
112
-
113
-
114
-
115
-
116
-
117
-
118
-
119
-
120
-
121
-
122
-
123
-
124
-
125
-
126
-
127
-
128
-
129
-
130
-
131
-
132
-
133
-
134
-
135
-
136
-
137
-
138
-
139
-
140
-
141
-
142
-
143
-
144
-
145
-
146
-
147
-
148
-
149
-
150
-
151
-
152
-
153
-
154
-
155
-
156
-
157
-
158
-
159
-
160
-
161
-
162
-
163
-
164
-
165
-
166
-
167
-
168
-
169
-
170
-
171
-
172
-
173
-
174
-
175
-
176
-
177
-
178
-
179
-
180
-
181
-
182
-
183
-
184
-
185
-
186
-
187
-
188
-
189
-
190
-
191
-
192
-
193
-
194
-
195
-
196
-
197
-
198
-
199
-
200
-
201
-
202
-
203
-
204
-
205
-
206
-
207
-
208
-
209
-
210
-
211
-
212
-
213
-
214
-
215
-
216
-
217
-
218
-
219
-
220
-
221
-
222
-
223
-
224
-
225
-
226
-
227
-
228
-
229
-
230
-
231
-
232
-
233
-
234
-
235
-
236
-
237
-
238
-
239
-
240
-
241
-
242
-
243
-
244
-
245
-
246
-
247
-
248
-
249
-
250
-
251
-
252
-
253
-
254
-
255
-
256
-
257
-
258
-
259
-
260
-
261
-
262
-
263
-
264
-
265
-
266
-
267
-
268
-
269
-
270
-
271
-
272
-
273
-
274
-
 275
275 -
 276
276 -
 277
277 -
 278
278 -
 279
279 -
 280
280 -
 281
281 -
 282
282 -
 283
283 -
 284
284 -
 285
285 -
 286
286 -
 287
287 -
 288
288 -
 289
289 -
 290
290 -
 291
291 -
 292
292 -
 293
293 -
 294
294 -
 295
295 -
296
-
297
-
298
-
299
-
300
-
301
-
302
-
303
-
304
-
305
-
306
-
307
-
308
-
309
-
310
-
311
-
312
-
313
-
314
-
315
-
316
-
317
-
318
-
319
-
320
-
321
-
322
-
323
-
324
-
325
-
326
-
327
-
328
-
329
-
330
-
331
-
332
-
333
-
334
-
335
-
336
-
337
-
338
-
339
-
340
-
341
-
342
-
343
-
344
-
345
-
346
-
347
-
348
-
349
-
350
-
351
-
352
-
353
-
354
-
355
-
356
-
357
-
358
-
359
-
360
-
361
-
362
-
363
-
364
-
365
-
366
-
367
-
368
-
369
-
370
-
371
-
372
-
373
-
374
-
375
-
376
-
377
-
378
-
379
-
380
-
381
-
382
-
383
-
384
-
385
-
386
-
387
-
388
-
389
-
390
-
391
-
392
-
393
-
394
-
395
-
396
 |
 |

283
Overview Operating & Financial Review Governance Financial Statements Shareholder Information
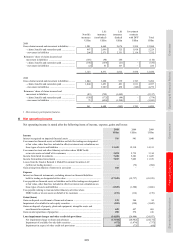
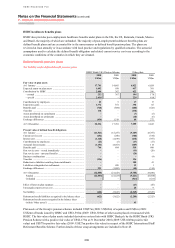
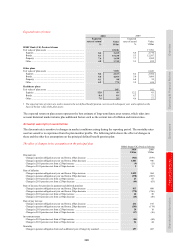
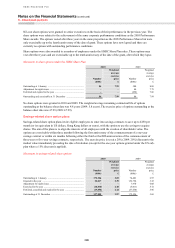
Expected rates of return
2010 2009
Expected
rates of return1 Value
Expected
rates of return1 Value
% US$m
% US$m
HSBC Bank (UK) Pension Scheme
Fair value of plan assets ............................................................... 22,236 17,701
Equities ..................................................................................... 8.4 3,415 8.4 2,770
Bonds ........................................................................................ 5.3 15,638 5.3 12,597
Property .................................................................................... 7.6 1,438 7.7 1,502
Other ......................................................................................... 4.0 1,745 5.3 832
Other plans
Fair value of plan assets ............................................................... 7,559 6,822
Equities ..................................................................................... 8.2 2,617 8.2 2,302
Bonds ........................................................................................ 5.0 4,073 5.0 3,809
Property .................................................................................... 6.1 98 6.4 55
Other ......................................................................................... 6.2 771 3.5 656
Healthcare plans
Fair value of plan assets ............................................................... 165 142
Equities ..................................................................................... 12.0 49 12.2 43
Bonds ........................................................................................ 8.4 81 8.7 72
Other .......................................................................................... 7.6 35 4.6 27
1 The expected rates of return are used to measure the net defined benefit pension costs in each subsequent year, and weighted on the
basis of the fair value of the plan assets.
The expected return on plan assets represents the best estimate of long-term future asset returns, which takes into
account historical market returns plus additional factors such as the current rate of inflation and interest rates.
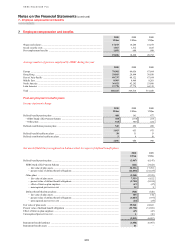
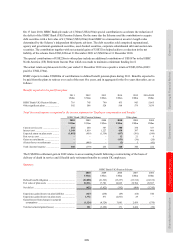
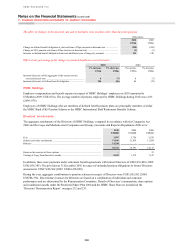
Actuarial assumption sensitivities
The discount rate is sensitive to changes in market conditions arising during the reporting period. The mortality rates
used are sensitive to experience from the plan member profile. The following table shows the effect of changes in
these and the other key assumptions on the principal defined benefit pension plan:
The effect of changes in key assumptions on the principal plan
HSBC Bank (UK) Pension Scheme
2010 2009
US$m US$m
Discount rate
Change in pension obligation at year end from a 25bps increase ....................................................... (941) (879)
Change in pension obligation at year end from a 25bps decrease ....................................................... 1,003 946
Change in 2011 pension cost from a 25bps increase ........................................................................... (9) (13)
Change in 2011 pension cost from a 25bps decrease .......................................................................... 9 13
Rate of inflation
Change in pension obligation at year end from a 25bps increase ....................................................... 1,029 964
Change in pension obligation at year end from a 25bps decrease ....................................................... (978) (907)
Change in 2011 pension cost from a 25bps increase ........................................................................... 67 65
Change in 2011 pension cost from a 25bps decrease .......................................................................... (64) (63)
Rate of increase for pensions in payment and deferred pensions
Change in pension obligation at year end from a 25bps increase ....................................................... 813 800
Change in pension obligation at year end from a 25bps decrease ....................................................... (775) (766)
Change in 2011 pension cost from a 25bps increase ........................................................................... 48 50
Change in 2011 pension cost from a 25bps decrease .......................................................................... (45) (49)
Rate of pay increase
Change in pension obligation at year end from a 25bps increase ....................................................... 216 195
Change in pension obligation at year end from a 25bps decrease ....................................................... (203) (174)
Change in 2011 pension cost from a 25bps increase ........................................................................... 20 18
Change in 2011 pension cost from a 25bps decrease .......................................................................... (17) (16)
Investment return
Change in 2011 pension cost from a 25bps increase ........................................................................... (54) (44)
Change in 2011 pension cost from a 25bps decrease .......................................................................... 54 44
Mortality
Change in pension obligation from each additional year of longevity assumed ................................. 497 487