HSBC 2010 Annual Report Download - page 282
Download and view the complete annual report
Please find page 282 of the 2010 HSBC annual report below. You can navigate through the pages in the report by either clicking on the pages listed below, or by using the keyword search tool below to find specific information within the annual report.-
 1
1 -
2
-
3
-
4
-
5
-
6
-
7
-
8
-
9
-
10
-
11
-
12
-
13
-
14
-
15
-
16
-
17
-
18
-
19
-
20
-
21
-
22
-
23
-
24
-
25
-
26
-
27
-
28
-
29
-
30
-
31
-
32
-
33
-
34
-
35
-
36
-
37
-
38
-
39
-
40
-
41
-
42
-
43
-
44
-
45
-
46
-
47
-
48
-
49
-
50
-
51
-
52
-
53
-
54
-
55
-
56
-
57
-
58
-
59
-
60
-
61
-
62
-
63
-
64
-
65
-
66
-
67
-
68
-
69
-
70
-
71
-
72
-
73
-
74
-
75
-
76
-
77
-
78
-
79
-
80
-
81
-
82
-
83
-
84
-
85
-
86
-
87
-
88
-
89
-
90
-
91
-
92
-
93
-
94
-
95
-
96
-
97
-
98
-
99
-
100
-
101
-
102
-
103
-
104
-
105
-
106
-
107
-
108
-
109
-
110
-
111
-
112
-
113
-
114
-
115
-
116
-
117
-
118
-
119
-
120
-
121
-
122
-
123
-
124
-
125
-
126
-
127
-
128
-
129
-
130
-
131
-
132
-
133
-
134
-
135
-
136
-
137
-
138
-
139
-
140
-
141
-
142
-
143
-
144
-
145
-
146
-
147
-
148
-
149
-
150
-
151
-
152
-
153
-
154
-
155
-
156
-
157
-
158
-
159
-
160
-
161
-
162
-
163
-
164
-
165
-
166
-
167
-
168
-
169
-
170
-
171
-
172
-
173
-
174
-
175
-
176
-
177
-
178
-
179
-
180
-
181
-
182
-
183
-
184
-
185
-
186
-
187
-
188
-
189
-
190
-
191
-
192
-
193
-
194
-
195
-
196
-
197
-
198
-
199
-
200
-
201
-
202
-
203
-
204
-
205
-
206
-
207
-
208
-
209
-
210
-
211
-
212
-
213
-
214
-
215
-
216
-
217
-
218
-
219
-
220
-
221
-
222
-
223
-
224
-
225
-
226
-
227
-
228
-
229
-
230
-
231
-
232
-
233
-
234
-
235
-
236
-
237
-
238
-
239
-
240
-
241
-
242
-
243
-
244
-
245
-
246
-
247
-
248
-
249
-
250
-
251
-
252
-
253
-
254
-
255
-
256
-
257
-
258
-
259
-
260
-
261
-
262
-
263
-
264
-
265
-
266
-
267
-
268
-
269
-
270
-
271
-
 272
272 -
 273
273 -
 274
274 -
 275
275 -
 276
276 -
 277
277 -
 278
278 -
 279
279 -
 280
280 -
 281
281 -
 282
282 -
 283
283 -
 284
284 -
 285
285 -
 286
286 -
 287
287 -
 288
288 -
 289
289 -
 290
290 -
 291
291 -
 292
292 -
293
-
294
-
295
-
296
-
297
-
298
-
299
-
300
-
301
-
302
-
303
-
304
-
305
-
306
-
307
-
308
-
309
-
310
-
311
-
312
-
313
-
314
-
315
-
316
-
317
-
318
-
319
-
320
-
321
-
322
-
323
-
324
-
325
-
326
-
327
-
328
-
329
-
330
-
331
-
332
-
333
-
334
-
335
-
336
-
337
-
338
-
339
-
340
-
341
-
342
-
343
-
344
-
345
-
346
-
347
-
348
-
349
-
350
-
351
-
352
-
353
-
354
-
355
-
356
-
357
-
358
-
359
-
360
-
361
-
362
-
363
-
364
-
365
-
366
-
367
-
368
-
369
-
370
-
371
-
372
-
373
-
374
-
375
-
376
-
377
-
378
-
379
-
380
-
381
-
382
-
383
-
384
-
385
-
386
-
387
-
388
-
389
-
390
-
391
-
392
-
393
-
394
-
395
-
396
 |
 |

HSBC HOLDINGS PLC
Notes on the Financial Statements (continued)
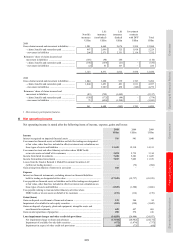
7 – Employee compensation and benefits
280
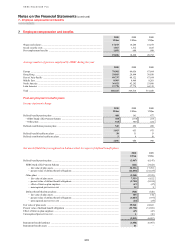
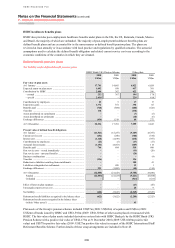
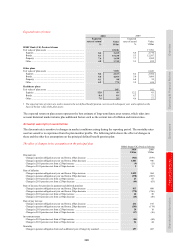
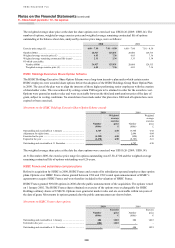
Summary (continued)
Other plans
2010 2009 2008 2007 2006
US$m US$m US$m US$m US$m
Defined benefit obligation ............................................ (9,785) (9,109) (8,787) (8,873) (7,916)
Fair value of plan assets ............................................... 7,559 6,822 6,024 7,768 7,116
Net deficit ..................................................................... (2,226) (2,287) (2,763) (1,105) (800)
Experience gains/(losses) on plan liabilities ................ (73) 20 (52) (354) (167)
Experience gains/(losses) on plan assets ...................... 394 65 (1,452) 157 203
Gains/(losses) from changes in actuarial
assumptions .............................................................. (596) 94 (306) (121) (44)
Total net actuarial gains/(losses) .................................. (275) 179 (1,810) (318) (8)
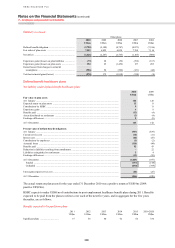
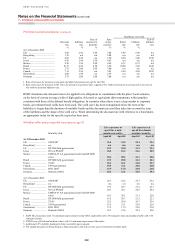
Defined benefit healthcare plans
Net liability under defined benefit healthcare plans
2010 2009
US$m US$m
Fair value of plan assets
At 1 January .............................................................................................................................................. 142 128
Expected return on plan assets ................................................................................................................. 13 11
Contributions by HSBC ............................................................................................................................ 9 11
Experience gains ....................................................................................................................................... 6 8
Benefits paid ............................................................................................................................................. (12) (4)
Assets distributed on settlements ............................................................................................................. (2) (4)
Exchange differences ................................................................................................................................ 9 (8)
At 31 December ........................................................................................................................................ 165 142
Present value of defined benefit obligations
At 1 January .............................................................................................................................................. (937) (839)
Current service cost .................................................................................................................................. (12) (11)
Interest cost ............................................................................................................................................... (60) (55)
Contributions by employees ..................................................................................................................... (1) (2)
Actuarial losses ......................................................................................................................................... (118) (44)
Benefits paid ............................................................................................................................................. 52 43
Reduction in liabilities resulting from curtailments ................................................................................. – 22
Liabilities extinguished on settlements .................................................................................................... 2 4
Exchange differences ................................................................................................................................ (13) (55)
At 31 December ........................................................................................................................................ (1,087) (937)
Funded .................................................................................................................................................. (197) (148)
Unfunded .............................................................................................................................................. (890) (789)
Unrecognised past service cost ................................................................................................................. (24) (25)
At 31 December ........................................................................................................................................ (946) (820)
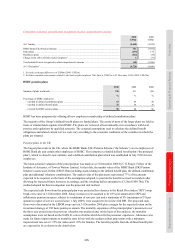
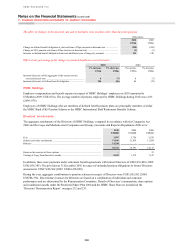
The actual return on plan assets for the year ended 31 December 2010 was a positive return of US$19m (2009:
positive US$19m).
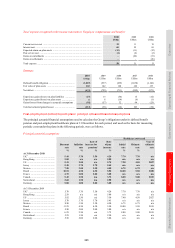
HSBC expects to make US$61m of contributions to post-employment healthcare benefit plans during 2011. Benefits
expected to be paid from the plans to retirees over each of the next five years, and in aggregate for the five years
thereafter, are as follows:
Benefits expected to be paid from plans
2011 2012 2013 2014 2015 2016-2020
US$m US$m US$m US$m US$m US$m
Significant plans ................................ 57 58 60 62 64 334