HSBC 2010 Annual Report Download - page 20
Download and view the complete annual report
Please find page 20 of the 2010 HSBC annual report below. You can navigate through the pages in the report by either clicking on the pages listed below, or by using the keyword search tool below to find specific information within the annual report.-
 1
1 -
2
-
3
-
4
-
5
-
6
-
7
-
8
-
9
-
 10
10 -
 11
11 -
 12
12 -
 13
13 -
 14
14 -
 15
15 -
 16
16 -
 17
17 -
 18
18 -
 19
19 -
 20
20 -
 21
21 -
 22
22 -
 23
23 -
 24
24 -
 25
25 -
 26
26 -
 27
27 -
 28
28 -
 29
29 -
 30
30 -
31
-
32
-
33
-
34
-
35
-
36
-
37
-
38
-
39
-
40
-
41
-
42
-
43
-
44
-
45
-
46
-
47
-
48
-
49
-
50
-
51
-
52
-
53
-
54
-
55
-
56
-
57
-
58
-
59
-
60
-
61
-
62
-
63
-
64
-
65
-
66
-
67
-
68
-
69
-
70
-
71
-
72
-
73
-
74
-
75
-
76
-
77
-
78
-
79
-
80
-
81
-
82
-
83
-
84
-
85
-
86
-
87
-
88
-
89
-
90
-
91
-
92
-
93
-
94
-
95
-
96
-
97
-
98
-
99
-
100
-
101
-
102
-
103
-
104
-
105
-
106
-
107
-
108
-
109
-
110
-
111
-
112
-
113
-
114
-
115
-
116
-
117
-
118
-
119
-
120
-
121
-
122
-
123
-
124
-
125
-
126
-
127
-
128
-
129
-
130
-
131
-
132
-
133
-
134
-
135
-
136
-
137
-
138
-
139
-
140
-
141
-
142
-
143
-
144
-
145
-
146
-
147
-
148
-
149
-
150
-
151
-
152
-
153
-
154
-
155
-
156
-
157
-
158
-
159
-
160
-
161
-
162
-
163
-
164
-
165
-
166
-
167
-
168
-
169
-
170
-
171
-
172
-
173
-
174
-
175
-
176
-
177
-
178
-
179
-
180
-
181
-
182
-
183
-
184
-
185
-
186
-
187
-
188
-
189
-
190
-
191
-
192
-
193
-
194
-
195
-
196
-
197
-
198
-
199
-
200
-
201
-
202
-
203
-
204
-
205
-
206
-
207
-
208
-
209
-
210
-
211
-
212
-
213
-
214
-
215
-
216
-
217
-
218
-
219
-
220
-
221
-
222
-
223
-
224
-
225
-
226
-
227
-
228
-
229
-
230
-
231
-
232
-
233
-
234
-
235
-
236
-
237
-
238
-
239
-
240
-
241
-
242
-
243
-
244
-
245
-
246
-
247
-
248
-
249
-
250
-
251
-
252
-
253
-
254
-
255
-
256
-
257
-
258
-
259
-
260
-
261
-
262
-
263
-
264
-
265
-
266
-
267
-
268
-
269
-
270
-
271
-
272
-
273
-
274
-
275
-
276
-
277
-
278
-
279
-
280
-
281
-
282
-
283
-
284
-
285
-
286
-
287
-
288
-
289
-
290
-
291
-
292
-
293
-
294
-
295
-
296
-
297
-
298
-
299
-
300
-
301
-
302
-
303
-
304
-
305
-
306
-
307
-
308
-
309
-
310
-
311
-
312
-
313
-
314
-
315
-
316
-
317
-
318
-
319
-
320
-
321
-
322
-
323
-
324
-
325
-
326
-
327
-
328
-
329
-
330
-
331
-
332
-
333
-
334
-
335
-
336
-
337
-
338
-
339
-
340
-
341
-
342
-
343
-
344
-
345
-
346
-
347
-
348
-
349
-
350
-
351
-
352
-
353
-
354
-
355
-
356
-
357
-
358
-
359
-
360
-
361
-
362
-
363
-
364
-
365
-
366
-
367
-
368
-
369
-
370
-
371
-
372
-
373
-
374
-
375
-
376
-
377
-
378
-
379
-
380
-
381
-
382
-
383
-
384
-
385
-
386
-
387
-
388
-
389
-
390
-
391
-
392
-
393
-
394
-
395
-
396
 |
 |

HSBC HOLDINGS PLC
Report of the Directors: Operating and Financial Review (continued)
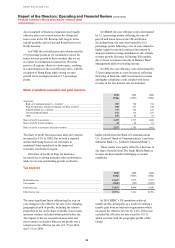
Financial summary > Group performance
18
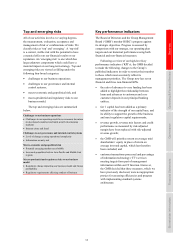
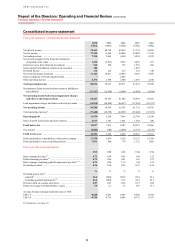
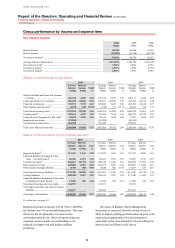
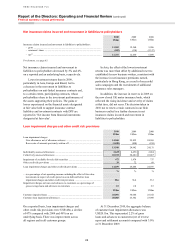
Group performance by income and expense item
Net interest income
2010 2009 2008
US$m US$m US$m
Interest income ........................................................................................................... 58,345 62,096 91,301
Interest expense .......................................................................................................... (18,904) (21,366) (48,738)
Net interest income20 .................................................................................................. 39,441 40,730 42,563
Average interest-earning assets .................................................................................. 1,472,294 1,384,705 1,466,622
Gross interest yield21 ................................................................................................... 3.96% 4.48% 6.23%
Net interest spread22 .................................................................................................... 2.55% 2.90% 2.87%
Net interest margin23 ................................................................................................... 2.68% 2.94% 2.90%
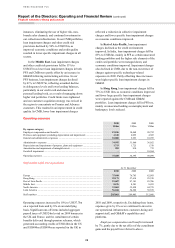
Summary of interest income by type of asset
2010 2009 2008
Average
balance
Interest
income Yield
Average
balance
Interest
income Yield
Average
balance
Interest
income Yield
US$m US$m % US$m US$m % US$m US$m %
Short-term funds and loans and advances
to banks .................................................... 236,742 4,555 1.92 192,578 4,199 2.18
240,111
9,646 4.02
Loans and advances to customers ............... 858,499 44,186 5.15 870,057 48,301 5.55 943,662 68,722 7.28
Financial investments .................................. 378,971 9,375 2.47 322,880 9,425 2.92 264,396 12,618 4.77
Other interest-earning assets24 ..................... (1,918) 229 (11.94) (810) 171 (21.11) 18,453 315 1.71
Total interest-earning assets ........................ 1,472,294 58,345 3.96 1,384,705 62,096 4.48 1,466,622 91,301 6.23
Trading assets25 ............................................ 332,511 6,027 1.81 357,504 7,614 2.13 428,539 16,742 3.91
Financial assets designated at fair value26 ... 52,692 1,033 1.96 62,143 1,032 1.66 37,303 1,108 2.97
Impairment provisions ................................. (22,905) (26,308)
(20,360)
Non-interest-earning assets ......................... 664,308
667,942 596,885
Total assets and interest income .................. 2,498,900 65,405 2.62 2,445,986 70,742 2.89 2,508,989 109,151 4.35
Summary of interest expense by type of liability and equity
2010 2009 2008
Average
balance
Interest
expense Cost
Average
balance
Interest
expense Cost
Average
balance
Interest
expense Cost
US$m US$m % US$m US$m % US$m US$m %
Deposits by banks27 ..................................... 111,443 1,136 1.02 117,847 1,659 1.41 135,747 4,959 3.65
Financial liabilities designated at fair
value – own debt issued28 ........................ 66,706 1,271 1.91 60,221 1,558 2.59
63,835 3,133 4.91
Customer accounts29 .................................... 962,613 10,778 1.12 940,918 11,346 1.21 950,854 27,989 2.94
Debt securities in issue ................................ 189,898 4,931 2.60 225,657 5,901 2.62 286,827 11,982 4.18
Other interest-bearing liabilities .................. 8,730 788 9.03 8,640 902 10.44 14,579 675 4.63
Total interest-bearing liabilities ................... 1,339,390 18,904 1.41 1,353,283 21,366 1.58 1,451,842 48,738 3.36
Trading liabilities ......................................... 258,348 3,497 1.35 205,670 3,987 1.94 277,940 11,029 3.97
Financial liabilities designated at fair value
(excluding own debt issued) ................... 17,456 283 1.62 15,688 293 1.87
21,266 345 1.62
Non-interest bearing current accounts ......... 142,579 123,271 98,193
Total equity and other non-interest bearing
liabilities .................................................. 741,127 748,074 659,747
Total equity and liabilities ........................... 2,498,900 22,684 0.91 2,445,986 25,646 1.05 2,508,988 60,112 2.40
For footnotes, see page 83.
Reported net interest income fell by 3% to US$39bn;
the decline was 5% on an underlying basis. This was
driven by the exceptionally low interest rate
environment and by the effect of repositioning our
customer assets towards secured lending as we
reduced our higher risk and higher yielding
portfolios.
Revenues in Balance Sheet Management
decreased, as expected, from the strong levels of
2009 as higher yielding positions taken in prior years
matured and opportunities for reinvestment at
equivalent yields were limited by the prevailing low
interest rates and flatter yield curves.