HSBC 2010 Annual Report Download - page 172
Download and view the complete annual report
Please find page 172 of the 2010 HSBC annual report below. You can navigate through the pages in the report by either clicking on the pages listed below, or by using the keyword search tool below to find specific information within the annual report.-
 1
1 -
2
-
3
-
4
-
5
-
6
-
7
-
8
-
9
-
10
-
11
-
12
-
13
-
14
-
15
-
16
-
17
-
18
-
19
-
20
-
21
-
22
-
23
-
24
-
25
-
26
-
27
-
28
-
29
-
30
-
31
-
32
-
33
-
34
-
35
-
36
-
37
-
38
-
39
-
40
-
41
-
42
-
43
-
44
-
45
-
46
-
47
-
48
-
49
-
50
-
51
-
52
-
53
-
54
-
55
-
56
-
57
-
58
-
59
-
60
-
61
-
62
-
63
-
64
-
65
-
66
-
67
-
68
-
69
-
70
-
71
-
72
-
73
-
74
-
75
-
76
-
77
-
78
-
79
-
80
-
81
-
82
-
83
-
84
-
85
-
86
-
87
-
88
-
89
-
90
-
91
-
92
-
93
-
94
-
95
-
96
-
97
-
98
-
99
-
100
-
101
-
102
-
103
-
104
-
105
-
106
-
107
-
108
-
109
-
110
-
111
-
112
-
113
-
114
-
115
-
116
-
117
-
118
-
119
-
120
-
121
-
122
-
123
-
124
-
125
-
126
-
127
-
128
-
129
-
130
-
131
-
132
-
133
-
134
-
135
-
136
-
137
-
138
-
139
-
140
-
141
-
142
-
143
-
144
-
145
-
146
-
147
-
148
-
149
-
150
-
151
-
152
-
153
-
154
-
155
-
156
-
157
-
158
-
159
-
160
-
161
-
 162
162 -
 163
163 -
 164
164 -
 165
165 -
 166
166 -
 167
167 -
 168
168 -
 169
169 -
 170
170 -
 171
171 -
 172
172 -
 173
173 -
 174
174 -
 175
175 -
 176
176 -
 177
177 -
 178
178 -
 179
179 -
 180
180 -
 181
181 -
 182
182 -
183
-
184
-
185
-
186
-
187
-
188
-
189
-
190
-
191
-
192
-
193
-
194
-
195
-
196
-
197
-
198
-
199
-
200
-
201
-
202
-
203
-
204
-
205
-
206
-
207
-
208
-
209
-
210
-
211
-
212
-
213
-
214
-
215
-
216
-
217
-
218
-
219
-
220
-
221
-
222
-
223
-
224
-
225
-
226
-
227
-
228
-
229
-
230
-
231
-
232
-
233
-
234
-
235
-
236
-
237
-
238
-
239
-
240
-
241
-
242
-
243
-
244
-
245
-
246
-
247
-
248
-
249
-
250
-
251
-
252
-
253
-
254
-
255
-
256
-
257
-
258
-
259
-
260
-
261
-
262
-
263
-
264
-
265
-
266
-
267
-
268
-
269
-
270
-
271
-
272
-
273
-
274
-
275
-
276
-
277
-
278
-
279
-
280
-
281
-
282
-
283
-
284
-
285
-
286
-
287
-
288
-
289
-
290
-
291
-
292
-
293
-
294
-
295
-
296
-
297
-
298
-
299
-
300
-
301
-
302
-
303
-
304
-
305
-
306
-
307
-
308
-
309
-
310
-
311
-
312
-
313
-
314
-
315
-
316
-
317
-
318
-
319
-
320
-
321
-
322
-
323
-
324
-
325
-
326
-
327
-
328
-
329
-
330
-
331
-
332
-
333
-
334
-
335
-
336
-
337
-
338
-
339
-
340
-
341
-
342
-
343
-
344
-
345
-
346
-
347
-
348
-
349
-
350
-
351
-
352
-
353
-
354
-
355
-
356
-
357
-
358
-
359
-
360
-
361
-
362
-
363
-
364
-
365
-
366
-
367
-
368
-
369
-
370
-
371
-
372
-
373
-
374
-
375
-
376
-
377
-
378
-
379
-
380
-
381
-
382
-
383
-
384
-
385
-
386
-
387
-
388
-
389
-
390
-
391
-
392
-
393
-
394
-
395
-
396
 |
 |

HSBC HOLDINGS PLC
Report of the Directors: Operating and Financial Review (continued)
Risk > Risk management of insurance operations > PVIF insurance business / Economic assumptions / Non-economic assumptions
170
Present value of in-force long-term
insurance business
(Audited)
Our life insurance business is accounted for using
the embedded value approach which, inter alia,
provides a comprehensive risk and valuation
framework. The present value of our in-force long-
term (‘PVIF’) asset at 31 December 2010 was
US$3.4bn (2009: US$2.8bn), representing the
present value of the shareholders’ interest in the
profits expected to emerge from the book of in-force
policies at that date.
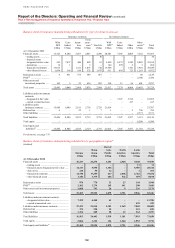
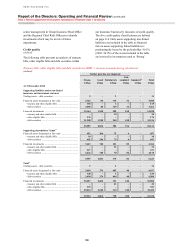
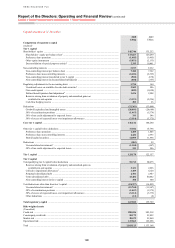
The following table shows the movements
recorded during the year in respect of total equity
and PVIF of insurance operations:
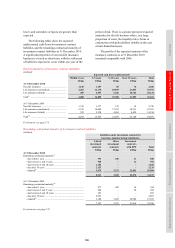
Movements in total equity and PVIF of insurance operations
(Audited)
2010 2009
Total
equity
PVIF
included in
total equity
Total
equity
PVIF
included in
total equity
US$m US$m US$m US$m
At 1 January .................................................................................. 8,580 2,780 7,577 2,033
Value of new business written during the year91 .......................... 737 737 600 600
Movements arising from in-force business:
– expected return ...................................................................... (85) (85) (123) (123)
– experience variances92 ........................................................... 20 20 (44) (44)
– change in operating assumptions .......................................... 58 58 48 48
Investment return variances .......................................................... 19 19 16 16
Changes in investment assumptions ............................................. (38) (38) 19 19
Return on net assets ...................................................................... 858 – 522 –
Exchange differences and other ................................................... (222) (51) (83) 231
Capital transactions ...................................................................... (149) – 48 –
At 31 December ............................................................................ 9,778 3,440 8,580 2,780
For footnotes, see page 174.
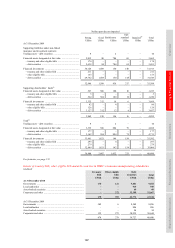
Key assumptions used in the computation of PVIF for main life insurance operations
2010 2009
UK Hong Kong France UK Hong Kong France
% % % % % %
Risk free rate .......................................................... 3.46 3.10 3.15 3.50 2.58 3.46
Risk discount rate .................................................. 7.00 11.00 8.00 7.00 11.00 8.00
Expenses inflation ................................................. 3.76 3.00 2.00 3.50 3.00 2.00
The calculation of the PVIF is based upon
assumptions that take into account risk and
uncertainty. To project these cash flows, a variety of
assumptions regarding future experience is made by
each insurance operation which reflects local market
conditions and management’s judgement of local
future trends. Some of the Group’s insurance
operations incorporate risk margins separately in the
projection assumptions for each product, while
others incorporate risk margins into the overall
discount rate. Both factors are reflected in the wide
range of risk discount rates applied.
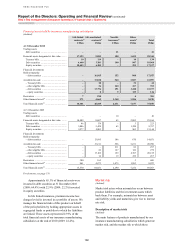
Economic assumptions
(Audited)
The following table shows the effect on the PVIF of
reasonably possible changes in the main economic
assumptions, namely the risk-free and risk discount
rates, across all insurance manufacturing
subsidiaries.
Due to certain characteristics of the contracts,
the relationships may be non-linear and the results
of the stress-testing should not be extrapolated to
higher levels of stress. In calculating the various
scenarios, all assumptions are held stable except
when testing the effect of the shift in the risk-free
rate, when resultant changes to investment returns,
risk discount rates and bonus rates are also
incorporated. The sensitivities shown are before
actions that could be taken by management to
mitigate effects and before resultant changes in
policyholder behaviour.