HSBC 2010 Annual Report Download - page 150
Download and view the complete annual report
Please find page 150 of the 2010 HSBC annual report below. You can navigate through the pages in the report by either clicking on the pages listed below, or by using the keyword search tool below to find specific information within the annual report.-
 1
1 -
2
-
3
-
4
-
5
-
6
-
7
-
8
-
9
-
10
-
11
-
12
-
13
-
14
-
15
-
16
-
17
-
18
-
19
-
20
-
21
-
22
-
23
-
24
-
25
-
26
-
27
-
28
-
29
-
30
-
31
-
32
-
33
-
34
-
35
-
36
-
37
-
38
-
39
-
40
-
41
-
42
-
43
-
44
-
45
-
46
-
47
-
48
-
49
-
50
-
51
-
52
-
53
-
54
-
55
-
56
-
57
-
58
-
59
-
60
-
61
-
62
-
63
-
64
-
65
-
66
-
67
-
68
-
69
-
70
-
71
-
72
-
73
-
74
-
75
-
76
-
77
-
78
-
79
-
80
-
81
-
82
-
83
-
84
-
85
-
86
-
87
-
88
-
89
-
90
-
91
-
92
-
93
-
94
-
95
-
96
-
97
-
98
-
99
-
100
-
101
-
102
-
103
-
104
-
105
-
106
-
107
-
108
-
109
-
110
-
111
-
112
-
113
-
114
-
115
-
116
-
117
-
118
-
119
-
120
-
121
-
122
-
123
-
124
-
125
-
126
-
127
-
128
-
129
-
130
-
131
-
132
-
133
-
134
-
135
-
136
-
137
-
138
-
139
-
 140
140 -
 141
141 -
 142
142 -
 143
143 -
 144
144 -
 145
145 -
 146
146 -
 147
147 -
 148
148 -
 149
149 -
 150
150 -
 151
151 -
 152
152 -
 153
153 -
 154
154 -
 155
155 -
 156
156 -
 157
157 -
 158
158 -
 159
159 -
 160
160 -
161
-
162
-
163
-
164
-
165
-
166
-
167
-
168
-
169
-
170
-
171
-
172
-
173
-
174
-
175
-
176
-
177
-
178
-
179
-
180
-
181
-
182
-
183
-
184
-
185
-
186
-
187
-
188
-
189
-
190
-
191
-
192
-
193
-
194
-
195
-
196
-
197
-
198
-
199
-
200
-
201
-
202
-
203
-
204
-
205
-
206
-
207
-
208
-
209
-
210
-
211
-
212
-
213
-
214
-
215
-
216
-
217
-
218
-
219
-
220
-
221
-
222
-
223
-
224
-
225
-
226
-
227
-
228
-
229
-
230
-
231
-
232
-
233
-
234
-
235
-
236
-
237
-
238
-
239
-
240
-
241
-
242
-
243
-
244
-
245
-
246
-
247
-
248
-
249
-
250
-
251
-
252
-
253
-
254
-
255
-
256
-
257
-
258
-
259
-
260
-
261
-
262
-
263
-
264
-
265
-
266
-
267
-
268
-
269
-
270
-
271
-
272
-
273
-
274
-
275
-
276
-
277
-
278
-
279
-
280
-
281
-
282
-
283
-
284
-
285
-
286
-
287
-
288
-
289
-
290
-
291
-
292
-
293
-
294
-
295
-
296
-
297
-
298
-
299
-
300
-
301
-
302
-
303
-
304
-
305
-
306
-
307
-
308
-
309
-
310
-
311
-
312
-
313
-
314
-
315
-
316
-
317
-
318
-
319
-
320
-
321
-
322
-
323
-
324
-
325
-
326
-
327
-
328
-
329
-
330
-
331
-
332
-
333
-
334
-
335
-
336
-
337
-
338
-
339
-
340
-
341
-
342
-
343
-
344
-
345
-
346
-
347
-
348
-
349
-
350
-
351
-
352
-
353
-
354
-
355
-
356
-
357
-
358
-
359
-
360
-
361
-
362
-
363
-
364
-
365
-
366
-
367
-
368
-
369
-
370
-
371
-
372
-
373
-
374
-
375
-
376
-
377
-
378
-
379
-
380
-
381
-
382
-
383
-
384
-
385
-
386
-
387
-
388
-
389
-
390
-
391
-
392
-
393
-
394
-
395
-
396
 |
 |

HSBC HOLDINGS PLC
Report of the Directors: Operating and Financial Review (continued)
Risk > Market risk > Trading and non-trading portfolios / Structural FX exposures / Sensitivity of NII
148
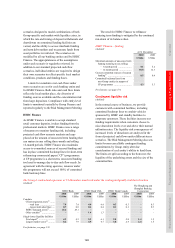
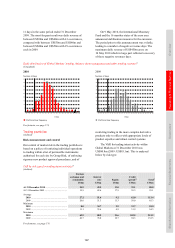
The VAR for overall trading intent activity as
at 31 December 2010 was lower than at the end of
2009, because of reduced volatility in various asset
classes. However, the wider band in VAR observed
in 2010 was driven by an increase in client-led
transactions and reduced portfolio diversification
benefit, which resulted in occasionally higher VAR
utilisation, as reflected in the above summary
statistics.
Credit spread risk
(Audited)
The risk associated with movements in credit
spreads is primarily managed through sensitivity
limits, stress testing and VAR for those portfolios
on which it is calculated.
At 31 December 2010, the Group credit spread
VAR was US$41.9m (2009: US$72.7m). The decrease
arose from the effect of volatile credit spread
scenarios rolling off from the VAR calculation.
Credit spread risk also arises on credit derivative
transactions entered into by Global Banking in
order to manage the risk concentrations within our
corporate loan portfolio and so enhance capital
efficiency. The mark-to-market of these transactions
is reflected in the income statement. At 31 December
2010, the credit VAR on the credit derivatives
transactions entered into by Global Banking was
US$12.3m (2009: US$13.8m).
Gap risk
Even for transactions that are structured to render
the risk to HSBC negligible under a wide range of
market conditions or events, there exists a remote
possibility that a significant gap event could lead
to loss. A gap event could arise from a significant
change in market price with no accompanying
trading opportunity, with the result that the threshold
is breached beyond which the risk profile changes
from no risk to full exposure to the underlying
structure. Such movements may occur, for example,
when, in reaction to an adverse event or unexpected
news announcement, the market for a specific
investment becomes illiquid, making hedging
impossible.
Given their characteristics, these transactions
make little or no contribution to VAR or to
traditional market risk sensitivity measures. We
capture their risks within our stress testing scenarios
and monitor gap risk on an ongoing basis. We
regularly consider the probability of gap loss, and
fair value adjustments are booked against this risk.
We did not incur any material gap loss in respect of
such transactions in 2010.
Non-trading portfolios
(Audited)
Risk measurement and control
The principal objective of market risk management
of non-trading portfolios is to optimise net interest
income. Interest rate risk in non-trading portfolios
arises principally from mismatches between the
future yield on assets and their funding cost, as a
result of interest rate changes. Analysis of this risk
is complicated by having to make assumptions on
embedded optionality within certain product areas
such as the incidence of mortgage prepayments,
and from behavioural assumptions regarding
the economic duration of liabilities which are
contractually repayable on demand such as current
accounts.
Our control of market risk in the non-trading
portfolios is based on transferring the risks to the
books managed by Global Markets or the local
ALCO. The net exposure is typically managed
through the use of interest rate swaps within agreed
limits. The VAR for these portfolios is included
within the Group VAR (see ‘Value at risk of the
trading and non-trading portfolios’ on page 146).
Credit spread risk
The risk associated with movements in credit
spreads is primarily managed through sensitivity
limits, stress testing, and VAR for those portfolios
where VAR is calculated. We have introduced credit
spread as a separate risk type within our VAR
models on a global basis. The VAR shows the effect
on income from a one-day movement in credit
spreads over a two-year period, calculated to a 99%
confidence interval.
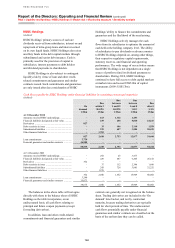
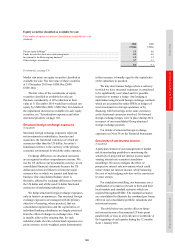
At 31 December 2010, the sensitivity of equity
capital to the effect of movements in credit spreads,
based on credit spread VAR, on our available-
for-sale debt securities was US$264m (2009:
US$535m). After including the gross exposure for
the SICs consolidated within our balance sheet, this
exposure rose to US$299m (2009: US$549m). This
sensitivity is calculated before taking into account
losses which would have been absorbed by the
capital note holders. At 31 December 2010, the
capital note holders can absorb the first US$2.2bn
(2009: US$2.2bn) of any losses incurred by the SICs
before we incur any equity losses.
The decrease in this sensitivity at 31 December
2010 compared with 31 December 2009 can be
explained by the effect of lower volatility in credit
spread scenarios observed during 2010.