HSBC 2010 Annual Report Download - page 62
Download and view the complete annual report
Please find page 62 of the 2010 HSBC annual report below. You can navigate through the pages in the report by either clicking on the pages listed below, or by using the keyword search tool below to find specific information within the annual report.-
 1
1 -
2
-
3
-
4
-
5
-
6
-
7
-
8
-
9
-
10
-
11
-
12
-
13
-
14
-
15
-
16
-
17
-
18
-
19
-
20
-
21
-
22
-
23
-
24
-
25
-
26
-
27
-
28
-
29
-
30
-
31
-
32
-
33
-
34
-
35
-
36
-
37
-
38
-
39
-
40
-
41
-
42
-
43
-
44
-
45
-
46
-
47
-
48
-
49
-
50
-
51
-
 52
52 -
 53
53 -
 54
54 -
 55
55 -
 56
56 -
 57
57 -
 58
58 -
 59
59 -
 60
60 -
 61
61 -
 62
62 -
 63
63 -
 64
64 -
 65
65 -
 66
66 -
 67
67 -
 68
68 -
 69
69 -
 70
70 -
 71
71 -
 72
72 -
73
-
74
-
75
-
76
-
77
-
78
-
79
-
80
-
81
-
82
-
83
-
84
-
85
-
86
-
87
-
88
-
89
-
90
-
91
-
92
-
93
-
94
-
95
-
96
-
97
-
98
-
99
-
100
-
101
-
102
-
103
-
104
-
105
-
106
-
107
-
108
-
109
-
110
-
111
-
112
-
113
-
114
-
115
-
116
-
117
-
118
-
119
-
120
-
121
-
122
-
123
-
124
-
125
-
126
-
127
-
128
-
129
-
130
-
131
-
132
-
133
-
134
-
135
-
136
-
137
-
138
-
139
-
140
-
141
-
142
-
143
-
144
-
145
-
146
-
147
-
148
-
149
-
150
-
151
-
152
-
153
-
154
-
155
-
156
-
157
-
158
-
159
-
160
-
161
-
162
-
163
-
164
-
165
-
166
-
167
-
168
-
169
-
170
-
171
-
172
-
173
-
174
-
175
-
176
-
177
-
178
-
179
-
180
-
181
-
182
-
183
-
184
-
185
-
186
-
187
-
188
-
189
-
190
-
191
-
192
-
193
-
194
-
195
-
196
-
197
-
198
-
199
-
200
-
201
-
202
-
203
-
204
-
205
-
206
-
207
-
208
-
209
-
210
-
211
-
212
-
213
-
214
-
215
-
216
-
217
-
218
-
219
-
220
-
221
-
222
-
223
-
224
-
225
-
226
-
227
-
228
-
229
-
230
-
231
-
232
-
233
-
234
-
235
-
236
-
237
-
238
-
239
-
240
-
241
-
242
-
243
-
244
-
245
-
246
-
247
-
248
-
249
-
250
-
251
-
252
-
253
-
254
-
255
-
256
-
257
-
258
-
259
-
260
-
261
-
262
-
263
-
264
-
265
-
266
-
267
-
268
-
269
-
270
-
271
-
272
-
273
-
274
-
275
-
276
-
277
-
278
-
279
-
280
-
281
-
282
-
283
-
284
-
285
-
286
-
287
-
288
-
289
-
290
-
291
-
292
-
293
-
294
-
295
-
296
-
297
-
298
-
299
-
300
-
301
-
302
-
303
-
304
-
305
-
306
-
307
-
308
-
309
-
310
-
311
-
312
-
313
-
314
-
315
-
316
-
317
-
318
-
319
-
320
-
321
-
322
-
323
-
324
-
325
-
326
-
327
-
328
-
329
-
330
-
331
-
332
-
333
-
334
-
335
-
336
-
337
-
338
-
339
-
340
-
341
-
342
-
343
-
344
-
345
-
346
-
347
-
348
-
349
-
350
-
351
-
352
-
353
-
354
-
355
-
356
-
357
-
358
-
359
-
360
-
361
-
362
-
363
-
364
-
365
-
366
-
367
-
368
-
369
-
370
-
371
-
372
-
373
-
374
-
375
-
376
-
377
-
378
-
379
-
380
-
381
-
382
-
383
-
384
-
385
-
386
-
387
-
388
-
389
-
390
-
391
-
392
-
393
-
394
-
395
-
396
 |
 |
HSBC HOLDINGS PLC
Report of the Directors: Operating and Financial Review (continued)
Geographical regions > Rest of Asia-Pacific
60
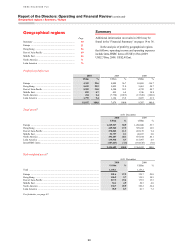
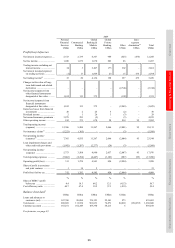
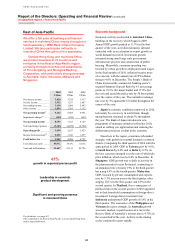
Rest of Asia-Pacific
We offer a full suite of banking and financial
services in mainland China, mainly through our
local subsidiary, HSBC Bank (China) Company
Limited. We also participate indirectly in
mainland China through our four associates.
Outside Hong Kong and mainland China,
we conduct business in 22 countries and
territories in the Rest of Asia-Pacific region,
primarily through branches and subsidiaries
of The Hongkong and Shanghai Banking
Corporation, with particularly strong coverage
in Australia, India, Indonesia, Malaysia and
Singapore.
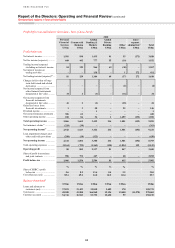
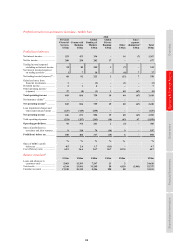
2010 2009 2008
US$m US$m US$m
Net interest income ........... 3,828 3,539 3,937
Net fee income .................. 1,932 1,557 1,867
Net trading income ........... 1,618 1,606 2,042
Other income .................... 1,854 1,301 1,135
Net operating income46 ... 9,232 8,003 8,981
Impairment charges47 ........ (439) (896) (852)
Net operating income ..... 8,793 7,107 8,129
Total operating expenses .. (5,143) (4,450) (4,704)
Operating profit .............. 3,650 2,657 3,425
Income from associates48 .. 2,252 1,543 1,297
Profit before tax .............. 5,902 4,200 4,722
Cost efficiency ratio ......... 55.7% 55.6% 52.4%
Year-end staff numbers .... 91,607 87,141 89,706
41%
growth in reported pre-tax profit
Leadership in renminbi
product development
Significant and growing presence
in mainland China
For footnotes, see page 83.
The commentary on Rest of Asia-Pacific is on an underlying basis
unless stated otherwise.
Economic background
Economic activity accelerated in mainland China,
building on the recovery which began in 2009.
Annual GDP growth peaked at 11.9% in the first
quarter of the year, as resilient domestic demand
coincided with an acceleration in export growth as
world demand recovered. Investment growth
remained strong amid large scale government
infrastructure projects and construction of public
housing. Meanwhile, consumer spending was
boosted by robust growth in employment and wages.
In the final months of 2010, inflation became more
of a concern, with the annual rate of CPI inflation
rising to 4.6% in December. The People’s Bank of
China increased the commercial banking sector’s
required Statutory Deposit Ratio by 4.5 percentage
points to 19.5% (for major banks) and 17.0% (for
the rest) and raised the policy rate by 50 basis points
over the course of the year. The renminbi exchange
rate rose by 3% against the US dollar throughout the
course of the year.
Japan’s economic conditions improved in 2010,
led mainly by a recovery in world trade, though
unemployment remained at about 5% throughout
the year. The Bank of Japan introduced a new
programme of monetary stimulus in October 2010,
aimed at curbing yen appreciation and reducing the
deflationary pressures evident in the economy.
Elsewhere in the region, economies rebounded
strongly, with growth in external demand a common
feature. Comparing the third quarter of 2010 with the
same period in 2009, GDP in Taiwan grew by 9.8%,
in South Korea by 4.4% and in India by 8.9%. In
the last, concerns emerged over the rate of wholesale
price inflation, which rose to 8.4% in December. In
Singapore, GDP growth was volatile as activity in
the pharmaceutical sector fluctuated, contracting at
an annualised rate of nearly 19% in the third quarter
but rising 6.9% in the fourth quarter. Malaysian
GDP, boosted by private consumption and exports,
rose by 5.3% year on year in the third quarter, after
surging 10.1% in the first quarter and 8.9% in the
second quarter. In Thailand, the re-emergence of
political risks in the second quarter of 2010 appeared
not to dent household consumption or foreign direct
investment. Foreign direct investment into
Indonesia underpinned GDP growth of 5.8% in the
third quarter. The economies of the Philippines and
Vietnam also grew strongly. In Australia growth
was more modest, in part because of a rise in the
Reserve Bank of Australia’s interest rate to 4.75% in
the second half of the year. Activity in the mining
sector continued to grow rapidly.