HSBC 2010 Annual Report Download - page 140
Download and view the complete annual report
Please find page 140 of the 2010 HSBC annual report below. You can navigate through the pages in the report by either clicking on the pages listed below, or by using the keyword search tool below to find specific information within the annual report.-
 1
1 -
2
-
3
-
4
-
5
-
6
-
7
-
8
-
9
-
10
-
11
-
12
-
13
-
14
-
15
-
16
-
17
-
18
-
19
-
20
-
21
-
22
-
23
-
24
-
25
-
26
-
27
-
28
-
29
-
30
-
31
-
32
-
33
-
34
-
35
-
36
-
37
-
38
-
39
-
40
-
41
-
42
-
43
-
44
-
45
-
46
-
47
-
48
-
49
-
50
-
51
-
52
-
53
-
54
-
55
-
56
-
57
-
58
-
59
-
60
-
61
-
62
-
63
-
64
-
65
-
66
-
67
-
68
-
69
-
70
-
71
-
72
-
73
-
74
-
75
-
76
-
77
-
78
-
79
-
80
-
81
-
82
-
83
-
84
-
85
-
86
-
87
-
88
-
89
-
90
-
91
-
92
-
93
-
94
-
95
-
96
-
97
-
98
-
99
-
100
-
101
-
102
-
103
-
104
-
105
-
106
-
107
-
108
-
109
-
110
-
111
-
112
-
113
-
114
-
115
-
116
-
117
-
118
-
119
-
120
-
121
-
122
-
123
-
124
-
125
-
126
-
127
-
128
-
129
-
 130
130 -
 131
131 -
 132
132 -
 133
133 -
 134
134 -
 135
135 -
 136
136 -
 137
137 -
 138
138 -
 139
139 -
 140
140 -
 141
141 -
 142
142 -
 143
143 -
 144
144 -
 145
145 -
 146
146 -
 147
147 -
 148
148 -
 149
149 -
 150
150 -
151
-
152
-
153
-
154
-
155
-
156
-
157
-
158
-
159
-
160
-
161
-
162
-
163
-
164
-
165
-
166
-
167
-
168
-
169
-
170
-
171
-
172
-
173
-
174
-
175
-
176
-
177
-
178
-
179
-
180
-
181
-
182
-
183
-
184
-
185
-
186
-
187
-
188
-
189
-
190
-
191
-
192
-
193
-
194
-
195
-
196
-
197
-
198
-
199
-
200
-
201
-
202
-
203
-
204
-
205
-
206
-
207
-
208
-
209
-
210
-
211
-
212
-
213
-
214
-
215
-
216
-
217
-
218
-
219
-
220
-
221
-
222
-
223
-
224
-
225
-
226
-
227
-
228
-
229
-
230
-
231
-
232
-
233
-
234
-
235
-
236
-
237
-
238
-
239
-
240
-
241
-
242
-
243
-
244
-
245
-
246
-
247
-
248
-
249
-
250
-
251
-
252
-
253
-
254
-
255
-
256
-
257
-
258
-
259
-
260
-
261
-
262
-
263
-
264
-
265
-
266
-
267
-
268
-
269
-
270
-
271
-
272
-
273
-
274
-
275
-
276
-
277
-
278
-
279
-
280
-
281
-
282
-
283
-
284
-
285
-
286
-
287
-
288
-
289
-
290
-
291
-
292
-
293
-
294
-
295
-
296
-
297
-
298
-
299
-
300
-
301
-
302
-
303
-
304
-
305
-
306
-
307
-
308
-
309
-
310
-
311
-
312
-
313
-
314
-
315
-
316
-
317
-
318
-
319
-
320
-
321
-
322
-
323
-
324
-
325
-
326
-
327
-
328
-
329
-
330
-
331
-
332
-
333
-
334
-
335
-
336
-
337
-
338
-
339
-
340
-
341
-
342
-
343
-
344
-
345
-
346
-
347
-
348
-
349
-
350
-
351
-
352
-
353
-
354
-
355
-
356
-
357
-
358
-
359
-
360
-
361
-
362
-
363
-
364
-
365
-
366
-
367
-
368
-
369
-
370
-
371
-
372
-
373
-
374
-
375
-
376
-
377
-
378
-
379
-
380
-
381
-
382
-
383
-
384
-
385
-
386
-
387
-
388
-
389
-
390
-
391
-
392
-
393
-
394
-
395
-
396
 |
 |

HSBC HOLDINGS PLC
Report of the Directors: Operating and Financial Review (continued)
Risk > Credit risk > Securitisation exposures and other structured products
138
Credit risk adjustments for monolines
• For highly-rated monolines, the standard credit risk
adjustment methodology (as described on page 312) applies,
with the exception that the future exposure profile is
deemed to be constant (equal to the current market value)
over the weighted average life of the referenced security,
and the credit risk adjustment cannot fall below 10% of the
mark-to-market exposure.
• In respect of monolines, where default has either occurred
or there is a strong possibility of default in the near term,
the adjustment is determined based on the estimated
probabilities of various potential scenarios, and the
estimated recovery in each case.
• For other monoline exposures, the credit risk adjustment
follows the methodology for highly-rated monolines,
adjusted to include the probability of a claim arising in
respect of the referenced security, and applies implied
probabilities of default where the likelihood of a claim is
believed to be high.
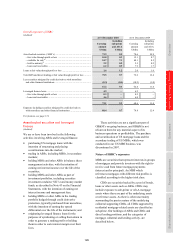
As described above, HSBC’s monoline credit
risk adjustment calculation utilises a range of
approaches dependent upon the credit quality of
the monoline. The net impact of utilising the
methodology adopted for ‘highly-rated’ monolines
across all monolines would be a reduction in credit
risk adjustment of US$94m. The net impact of
utilising a methodology based on credit default swap
spreads would be an increase in credit risk
adjustment of US$8m.
At 31 December 2010, US$1.4bn (2009:
US$2.6bn) notional value of securities referenced by
monoline CDS transactions with a market value of
US$1.0bn (2009: US$1.9bn) were held in the loans
and receivables category, having been included in
the reclassification of financial assets described in
Note 18 on the Financial Statements. At the date of
reclassification, the market value of the remaining
assets was US$1.2bn. The reclassification resulted in
an accounting asymmetry between the CDSs, which
continue to be held at fair value through profit and
loss, and the reclassified securities, which are
accounted for on an amortised cost basis. If the
reclassifications had not occurred, the impact on the
income statement for 2010 would have been
a decrease in profit of US$3m (2009: increase in
profit of US$5m). This amount represents the
difference between the increase in market value of
the securities during 2010 and the accretion
recognised under the amortised cost method in 2010.
HSBC’s exposure to direct lending and
irrevocable commitments to lend to monolines
HSBC had no liquidity facilities to monolines at
31 December 2010 (2009: minimal).
HSBC’s exposure to debt securities which benefit
from guarantees provided by monolines
Within both the trading and available-for-sale
portfolios, we hold bonds that are ‘wrapped’ with
a credit enhancement from a monoline. As the
bonds are traded explicitly with the benefit of this
enhancement, any deterioration in the credit profile
of the monoline is reflected in market prices and,
therefore, in the carrying amount of these securities
at 31 December 2010. For wrapped bonds held in
our trading portfolio, the mark-to-market movement
has been reflected through the income statement. For
wrapped bonds held in the available-for-sale portfolio,
the mark-to-market movement is reflected in equity
unless there is objective evidence of impairment, in
which case the impairment loss is reflected in the
income statement. No wrapped bonds were included
in the reclassification of financial assets described in
Note 18 on the Financial Statements.
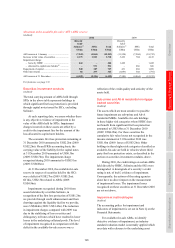
HSBC’s exposure to Credit Derivative
Product Companies
(Audited)
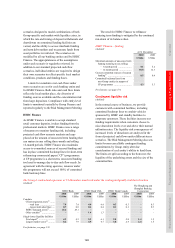
Credit Derivative Product Companies (‘CDPC’s)
are independent companies that specialise in selling
credit default protection on corporate exposures.
OTC derivative exposure to CDPCs became a focus
during the second half of 2008 as the spreads
widened, but these exposures reduced during 2009
as the spreads tightened again. At 31 December
2010, HSBC had purchased from CDPCs credit
protection with a notional value of US$4.9bn (2009:
US$5.0bn) which had a fair value of US$0.2bn
(2009: US$0.3bn), against which a credit risk
adjustment (a provision) of US$0.1bn (2009:
US$0.1bn) was held. At 31 December 2010, none of
the exposure was to CDPCs with investment grade
ratings (2009: 83%). The deterioration reflects rating
downgrades and withdrawals during 2010.
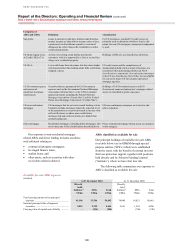
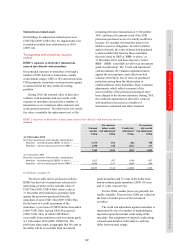
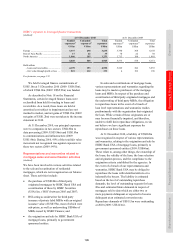
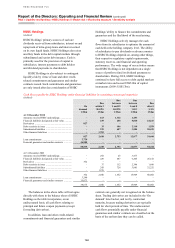
Leveraged finance transactions
(Audited)
Leveraged finance transactions include sub-
investment grade acquisition or event-driven
financing. The following table shows our exposure
to leveraged finance transactions arising from
primary transactions. Our additional exposure to
leveraged finance loans through holdings of ABSs
from our trading and investment activities is shown
in the table on page 133.