HSBC 2010 Annual Report Download - page 324
Download and view the complete annual report
Please find page 324 of the 2010 HSBC annual report below. You can navigate through the pages in the report by either clicking on the pages listed below, or by using the keyword search tool below to find specific information within the annual report.-
 1
1 -
2
-
3
-
4
-
5
-
6
-
7
-
8
-
9
-
10
-
11
-
12
-
13
-
14
-
15
-
16
-
17
-
18
-
19
-
20
-
21
-
22
-
23
-
24
-
25
-
26
-
27
-
28
-
29
-
30
-
31
-
32
-
33
-
34
-
35
-
36
-
37
-
38
-
39
-
40
-
41
-
42
-
43
-
44
-
45
-
46
-
47
-
48
-
49
-
50
-
51
-
52
-
53
-
54
-
55
-
56
-
57
-
58
-
59
-
60
-
61
-
62
-
63
-
64
-
65
-
66
-
67
-
68
-
69
-
70
-
71
-
72
-
73
-
74
-
75
-
76
-
77
-
78
-
79
-
80
-
81
-
82
-
83
-
84
-
85
-
86
-
87
-
88
-
89
-
90
-
91
-
92
-
93
-
94
-
95
-
96
-
97
-
98
-
99
-
100
-
101
-
102
-
103
-
104
-
105
-
106
-
107
-
108
-
109
-
110
-
111
-
112
-
113
-
114
-
115
-
116
-
117
-
118
-
119
-
120
-
121
-
122
-
123
-
124
-
125
-
126
-
127
-
128
-
129
-
130
-
131
-
132
-
133
-
134
-
135
-
136
-
137
-
138
-
139
-
140
-
141
-
142
-
143
-
144
-
145
-
146
-
147
-
148
-
149
-
150
-
151
-
152
-
153
-
154
-
155
-
156
-
157
-
158
-
159
-
160
-
161
-
162
-
163
-
164
-
165
-
166
-
167
-
168
-
169
-
170
-
171
-
172
-
173
-
174
-
175
-
176
-
177
-
178
-
179
-
180
-
181
-
182
-
183
-
184
-
185
-
186
-
187
-
188
-
189
-
190
-
191
-
192
-
193
-
194
-
195
-
196
-
197
-
198
-
199
-
200
-
201
-
202
-
203
-
204
-
205
-
206
-
207
-
208
-
209
-
210
-
211
-
212
-
213
-
214
-
215
-
216
-
217
-
218
-
219
-
220
-
221
-
222
-
223
-
224
-
225
-
226
-
227
-
228
-
229
-
230
-
231
-
232
-
233
-
234
-
235
-
236
-
237
-
238
-
239
-
240
-
241
-
242
-
243
-
244
-
245
-
246
-
247
-
248
-
249
-
250
-
251
-
252
-
253
-
254
-
255
-
256
-
257
-
258
-
259
-
260
-
261
-
262
-
263
-
264
-
265
-
266
-
267
-
268
-
269
-
270
-
271
-
272
-
273
-
274
-
275
-
276
-
277
-
278
-
279
-
280
-
281
-
282
-
283
-
284
-
285
-
286
-
287
-
288
-
289
-
290
-
291
-
292
-
293
-
294
-
295
-
296
-
297
-
298
-
299
-
300
-
301
-
302
-
303
-
304
-
305
-
306
-
307
-
308
-
309
-
310
-
311
-
312
-
313
-
 314
314 -
 315
315 -
 316
316 -
 317
317 -
 318
318 -
 319
319 -
 320
320 -
 321
321 -
 322
322 -
 323
323 -
 324
324 -
 325
325 -
 326
326 -
 327
327 -
 328
328 -
 329
329 -
 330
330 -
 331
331 -
 332
332 -
 333
333 -
 334
334 -
335
-
336
-
337
-
338
-
339
-
340
-
341
-
342
-
343
-
344
-
345
-
346
-
347
-
348
-
349
-
350
-
351
-
352
-
353
-
354
-
355
-
356
-
357
-
358
-
359
-
360
-
361
-
362
-
363
-
364
-
365
-
366
-
367
-
368
-
369
-
370
-
371
-
372
-
373
-
374
-
375
-
376
-
377
-
378
-
379
-
380
-
381
-
382
-
383
-
384
-
385
-
386
-
387
-
388
-
389
-
390
-
391
-
392
-
393
-
394
-
395
-
396
 |
 |

HSBC HOLDINGS PLC
Notes on the Financial Statements (continued)
20 – Derivatives
322
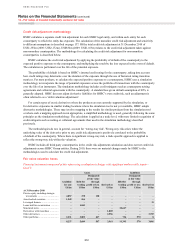
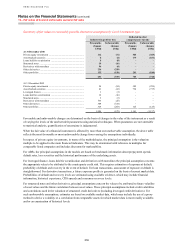
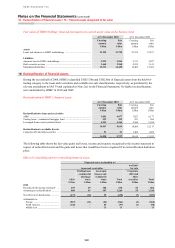
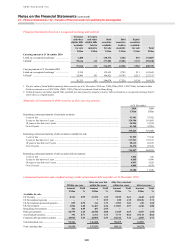
Securities listed on a recognised exchange and unlisted
Treasury
and other
eligible bills
Debt
securities
Equity
securities
Total
US$m US$m US$m US$m
Fair value at 31 December 2010
Listed on a recognised exchange1 ................................................ 21 4,168 12,548 16,737
Unlisted ......................................................................................... 138 14,080 4,870 19,088
159 18,248 17,418 35,825
Fair value at 31 December 2009
Listed on a recognised exchange1 ................................................ 78 7,168 10,549 17,795
Unlisted ......................................................................................... 145 13,550 4,434 18,129
223 20,718 14,983 35,924
1 Included within listed investments are US$756m of investments listed in Hong Kong (2009: US$506m).
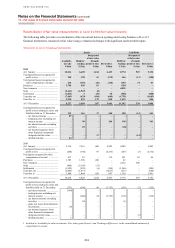
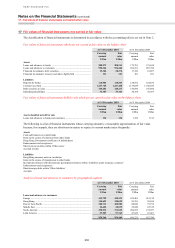
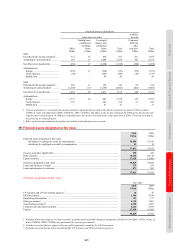
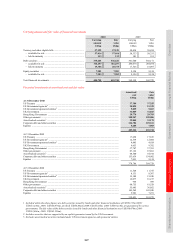
20 Derivatives
Fair values of derivatives by product contract type held by HSBC
Assets Liabilities
Trading Hedging Total Trading Hedging Total
US$m US$m US$m US$m US$m US$m
At 31 December 2010
Foreign exchange ................................................ 65,905 1,304 67,209 67,564 340 67,904
Interest rate ......................................................... 278,364 2,764 281,128 273,222 3,909 277,131
Equity .................................................................. 13,983 – 13,983 14,716 – 14,716
Credit .................................................................. 20,907 – 20,907 20,027 – 20,027
Commodity and other ......................................... 1,261 – 1,261 2,618 – 2,618
Gross total fair values ......................................... 380,420 4,068 384,488 378,147 4,249 382,396
Netting ................................................................ (123,731) (123,731)
Total .................................................................... 260,757 258,665
At 31 December 2009
Foreign exchange ................................................ 55,036 1,695 56,731 54,502 300 54,802
Interest rate ......................................................... 212,102 3,506 215,608 209,351 3,274 212,625
Equity .................................................................. 15,729 – 15,729 19,013 – 19,013
Credit .................................................................. 28,479 – 28,479 27,042 – 27,042
Commodity and other ......................................... 1,135 – 1,135 960 – 960
Gross total fair values ......................................... 312,481 5,201 317,682 310,868 3,574 314,442
Netting ................................................................ (66,796) (66,796)
Total .................................................................... 250,886 247,646
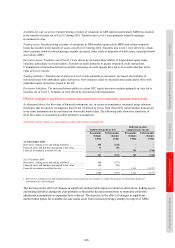
The 4% increase in the fair value of derivative assets during 2010 was driven both by this increased volume of open
trades and by small net declines in yield curves of major currencies over the year. The netting adjustment increased as
increasing volumes of transactions, particularly interest rate derivatives and credit derivatives, were executed through
clearing houses, where the settlement arrangements satisfied the IFRS netting criteria.
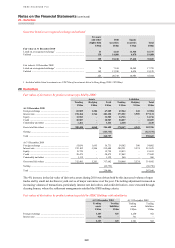
Fair values of derivatives by product contract type held by HSBC Holdings with subsidiaries
At 31 December 2010 At 31 December 2009
Trading Trading Trading Trading
assets liabilities assets liabilities
US$m US$m US$m US$m
Foreign exchange .......................................................................... 1,407 827 2,250 362
Interest rate ................................................................................... 920 – 731 –
2,327 827 2,981 362