HSBC 2010 Annual Report Download - page 353
Download and view the complete annual report
Please find page 353 of the 2010 HSBC annual report below. You can navigate through the pages in the report by either clicking on the pages listed below, or by using the keyword search tool below to find specific information within the annual report.-
 1
1 -
2
-
3
-
4
-
5
-
6
-
7
-
8
-
9
-
10
-
11
-
12
-
13
-
14
-
15
-
16
-
17
-
18
-
19
-
20
-
21
-
22
-
23
-
24
-
25
-
26
-
27
-
28
-
29
-
30
-
31
-
32
-
33
-
34
-
35
-
36
-
37
-
38
-
39
-
40
-
41
-
42
-
43
-
44
-
45
-
46
-
47
-
48
-
49
-
50
-
51
-
52
-
53
-
54
-
55
-
56
-
57
-
58
-
59
-
60
-
61
-
62
-
63
-
64
-
65
-
66
-
67
-
68
-
69
-
70
-
71
-
72
-
73
-
74
-
75
-
76
-
77
-
78
-
79
-
80
-
81
-
82
-
83
-
84
-
85
-
86
-
87
-
88
-
89
-
90
-
91
-
92
-
93
-
94
-
95
-
96
-
97
-
98
-
99
-
100
-
101
-
102
-
103
-
104
-
105
-
106
-
107
-
108
-
109
-
110
-
111
-
112
-
113
-
114
-
115
-
116
-
117
-
118
-
119
-
120
-
121
-
122
-
123
-
124
-
125
-
126
-
127
-
128
-
129
-
130
-
131
-
132
-
133
-
134
-
135
-
136
-
137
-
138
-
139
-
140
-
141
-
142
-
143
-
144
-
145
-
146
-
147
-
148
-
149
-
150
-
151
-
152
-
153
-
154
-
155
-
156
-
157
-
158
-
159
-
160
-
161
-
162
-
163
-
164
-
165
-
166
-
167
-
168
-
169
-
170
-
171
-
172
-
173
-
174
-
175
-
176
-
177
-
178
-
179
-
180
-
181
-
182
-
183
-
184
-
185
-
186
-
187
-
188
-
189
-
190
-
191
-
192
-
193
-
194
-
195
-
196
-
197
-
198
-
199
-
200
-
201
-
202
-
203
-
204
-
205
-
206
-
207
-
208
-
209
-
210
-
211
-
212
-
213
-
214
-
215
-
216
-
217
-
218
-
219
-
220
-
221
-
222
-
223
-
224
-
225
-
226
-
227
-
228
-
229
-
230
-
231
-
232
-
233
-
234
-
235
-
236
-
237
-
238
-
239
-
240
-
241
-
242
-
243
-
244
-
245
-
246
-
247
-
248
-
249
-
250
-
251
-
252
-
253
-
254
-
255
-
256
-
257
-
258
-
259
-
260
-
261
-
262
-
263
-
264
-
265
-
266
-
267
-
268
-
269
-
270
-
271
-
272
-
273
-
274
-
275
-
276
-
277
-
278
-
279
-
280
-
281
-
282
-
283
-
284
-
285
-
286
-
287
-
288
-
289
-
290
-
291
-
292
-
293
-
294
-
295
-
296
-
297
-
298
-
299
-
300
-
301
-
302
-
303
-
304
-
305
-
306
-
307
-
308
-
309
-
310
-
311
-
312
-
313
-
314
-
315
-
316
-
317
-
318
-
319
-
320
-
321
-
322
-
323
-
324
-
325
-
326
-
327
-
328
-
329
-
330
-
331
-
332
-
333
-
334
-
335
-
336
-
337
-
338
-
339
-
340
-
341
-
342
-
 343
343 -
 344
344 -
 345
345 -
 346
346 -
 347
347 -
 348
348 -
 349
349 -
 350
350 -
 351
351 -
 352
352 -
 353
353 -
 354
354 -
 355
355 -
 356
356 -
 357
357 -
 358
358 -
 359
359 -
 360
360 -
 361
361 -
 362
362 -
 363
363 -
364
-
365
-
366
-
367
-
368
-
369
-
370
-
371
-
372
-
373
-
374
-
375
-
376
-
377
-
378
-
379
-
380
-
381
-
382
-
383
-
384
-
385
-
386
-
387
-
388
-
389
-
390
-
391
-
392
-
393
-
394
-
395
-
396
 |
 |
351
Overview Operating & Financial Review Governance Financial Statements Shareholder Information
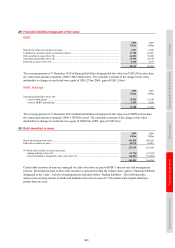
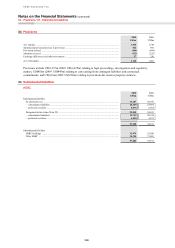
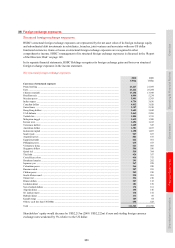
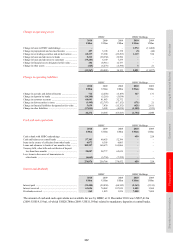
36 Foreign exchange exposures
Structural foreign exchange exposures
HSBC’s structural foreign exchange exposures are represented by the net asset value of its foreign exchange equity
and subordinated debt investments in subsidiaries, branches, joint ventures and associates with non-US dollar
functional currencies. Gains or losses on structural foreign exchange exposures are recognised in other
comprehensive income. HSBC’s management of its structural foreign exchange exposures is discussed in the ‘Report
of the Directors: Risk’ on page 149.
In its separate financial statements, HSBC Holdings recognises its foreign exchange gains and losses on structural
foreign exchange exposures in the income statement.
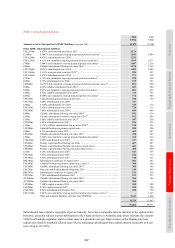
Net structural foreign exchange exposures
2010 2009
US$m US$m
Currency of structural exposure
Pound sterling ........................................................................................................................................... 23,247 21,369
Euro ........................................................................................................................................................... 23,222 25,284
Chinese renminbi ...................................................................................................................................... 17,454 13,398
Brazilian reais ........................................................................................................................................... 6,004 5,234
Mexican pesos .......................................................................................................................................... 5,991 5,393
Indian rupees ............................................................................................................................................. 4,754 3,836
Canadian dollars ....................................................................................................................................... 4,012 3,620
Swiss francs .............................................................................................................................................. 3,357 2,910
Hong Kong dollars ................................................................................................................................... 2,659 3,842
UAE dirhams ............................................................................................................................................ 2,469 2,209
Turkish lira ................................................................................................................................................ 1,854 1,741
Malaysian ringgit ...................................................................................................................................... 1,619 1,300
Korean won ............................................................................................................................................... 1,456 1,412
Taiwanese dollars ..................................................................................................................................... 1,429 547
Australian dollars ...................................................................................................................................... 1,381 1,017
Indonesian rupiah ..................................................................................................................................... 1,190 1,057
Saudi riyals ............................................................................................................................................... 907 657
Argentine pesos ........................................................................................................................................ 881 675
Egyptian pounds ....................................................................................................................................... 642 561
Philippine pesos ........................................................................................................................................ 635 473
Vietnamese dong ...................................................................................................................................... 621 505
Singapore dollars ...................................................................................................................................... 596 556
Qatari rial .................................................................................................................................................. 510 384
Thai baht ................................................................................................................................................... 424 357
Costa Rican colon ..................................................................................................................................... 416 375
Honduran lempira ..................................................................................................................................... 291 282
Japanese yen ............................................................................................................................................. 267 228
Colombian pesos ....................................................................................................................................... 266 220
Russian rouble .......................................................................................................................................... 257 295
Chilean pesos ............................................................................................................................................ 249 230
South African rand ................................................................................................................................... 238 201
Omani rial ................................................................................................................................................. 234 210
Brunei dollars ........................................................................................................................................... 227 132
Jordanian dinar ......................................................................................................................................... 181 159
New Zealand dollars ................................................................................................................................. 172 161
Algerian dinar ........................................................................................................................................... 155 146
Sri Lankan rupee ....................................................................................................................................... 136 141
Bahraini dinar ........................................................................................................................................... 133 85
Kazakh tenge ............................................................................................................................................ 109 64
Others, each less than US$100m .............................................................................................................. 658 523
Total .......................................................................................................................................................... 111,303 101,789
Shareholders’ equity would decrease by US$2,213m (2009: US$2,222m) if euro and sterling foreign currency
exchange rates weakened by 5% relative to the US dollar.