HSBC 2010 Annual Report Download - page 16
Download and view the complete annual report
Please find page 16 of the 2010 HSBC annual report below. You can navigate through the pages in the report by either clicking on the pages listed below, or by using the keyword search tool below to find specific information within the annual report.-
 1
1 -
2
-
3
-
4
-
5
-
 6
6 -
 7
7 -
 8
8 -
 9
9 -
 10
10 -
 11
11 -
 12
12 -
 13
13 -
 14
14 -
 15
15 -
 16
16 -
 17
17 -
 18
18 -
 19
19 -
 20
20 -
 21
21 -
 22
22 -
 23
23 -
 24
24 -
 25
25 -
 26
26 -
27
-
28
-
29
-
30
-
31
-
32
-
33
-
34
-
35
-
36
-
37
-
38
-
39
-
40
-
41
-
42
-
43
-
44
-
45
-
46
-
47
-
48
-
49
-
50
-
51
-
52
-
53
-
54
-
55
-
56
-
57
-
58
-
59
-
60
-
61
-
62
-
63
-
64
-
65
-
66
-
67
-
68
-
69
-
70
-
71
-
72
-
73
-
74
-
75
-
76
-
77
-
78
-
79
-
80
-
81
-
82
-
83
-
84
-
85
-
86
-
87
-
88
-
89
-
90
-
91
-
92
-
93
-
94
-
95
-
96
-
97
-
98
-
99
-
100
-
101
-
102
-
103
-
104
-
105
-
106
-
107
-
108
-
109
-
110
-
111
-
112
-
113
-
114
-
115
-
116
-
117
-
118
-
119
-
120
-
121
-
122
-
123
-
124
-
125
-
126
-
127
-
128
-
129
-
130
-
131
-
132
-
133
-
134
-
135
-
136
-
137
-
138
-
139
-
140
-
141
-
142
-
143
-
144
-
145
-
146
-
147
-
148
-
149
-
150
-
151
-
152
-
153
-
154
-
155
-
156
-
157
-
158
-
159
-
160
-
161
-
162
-
163
-
164
-
165
-
166
-
167
-
168
-
169
-
170
-
171
-
172
-
173
-
174
-
175
-
176
-
177
-
178
-
179
-
180
-
181
-
182
-
183
-
184
-
185
-
186
-
187
-
188
-
189
-
190
-
191
-
192
-
193
-
194
-
195
-
196
-
197
-
198
-
199
-
200
-
201
-
202
-
203
-
204
-
205
-
206
-
207
-
208
-
209
-
210
-
211
-
212
-
213
-
214
-
215
-
216
-
217
-
218
-
219
-
220
-
221
-
222
-
223
-
224
-
225
-
226
-
227
-
228
-
229
-
230
-
231
-
232
-
233
-
234
-
235
-
236
-
237
-
238
-
239
-
240
-
241
-
242
-
243
-
244
-
245
-
246
-
247
-
248
-
249
-
250
-
251
-
252
-
253
-
254
-
255
-
256
-
257
-
258
-
259
-
260
-
261
-
262
-
263
-
264
-
265
-
266
-
267
-
268
-
269
-
270
-
271
-
272
-
273
-
274
-
275
-
276
-
277
-
278
-
279
-
280
-
281
-
282
-
283
-
284
-
285
-
286
-
287
-
288
-
289
-
290
-
291
-
292
-
293
-
294
-
295
-
296
-
297
-
298
-
299
-
300
-
301
-
302
-
303
-
304
-
305
-
306
-
307
-
308
-
309
-
310
-
311
-
312
-
313
-
314
-
315
-
316
-
317
-
318
-
319
-
320
-
321
-
322
-
323
-
324
-
325
-
326
-
327
-
328
-
329
-
330
-
331
-
332
-
333
-
334
-
335
-
336
-
337
-
338
-
339
-
340
-
341
-
342
-
343
-
344
-
345
-
346
-
347
-
348
-
349
-
350
-
351
-
352
-
353
-
354
-
355
-
356
-
357
-
358
-
359
-
360
-
361
-
362
-
363
-
364
-
365
-
366
-
367
-
368
-
369
-
370
-
371
-
372
-
373
-
374
-
375
-
376
-
377
-
378
-
379
-
380
-
381
-
382
-
383
-
384
-
385
-
386
-
387
-
388
-
389
-
390
-
391
-
392
-
393
-
394
-
395
-
396
 |
 |

HSBC HOLDINGS PLC
Report of the Directors: Operating and Financial Review
Financial summary > Reconciliation of profit before tax
14
Financial summary
Page
Reconciliation of reported and underlying profit
before tax .................................................................. 14
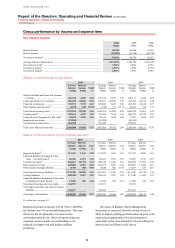
Consolidated income statement .................................... 16
Group performance by income and expense item ........ 18
Net interest income ................................................... 18
Net fee income .......................................................... 19
Net trading income ................................................... 20
Net income from financial instruments designated
at fair value .......................................................... 21
Gains less losses from financial investments ........... 22
Net earned insurance premiums .............................. 22
Other operating income ........................................... 23
Page
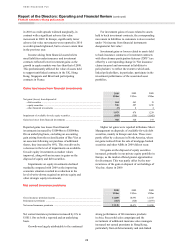
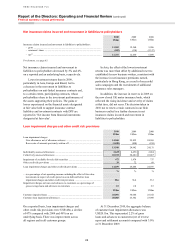
Net insurance claims incurred and movement in
liabilities to policyholders .................................... 24
Loan impairment charges and other credit risk
provisions ............................................................. 24
Operating expenses .................................................. 26
Share of profit in associates and joint ventures ....... 28
Tax expense .............................................................. 28
Consolidated balance sheet ........................................... 29
Movement in 2010 .................................................... 30
Economic profit ............................................................ 32
Critical accounting policies .......................................... 33
The management commentary included in the Report of the Directors: ‘Overview’ and ‘Operating and Financial Review’, together with the
‘Employees’ and ‘Corporate sustainability’ sections of ‘Governance’ and the ‘Directors’ Remuneration Report’ is presented in compliance
with the IFRS Practice Statement Management Commentary issued by the IASB.
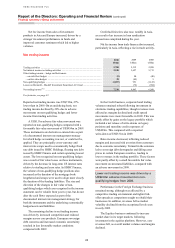
Reconciliation of reported and
underlying profit before tax
We measure our performance internally on a like-
for-like basis by eliminating the effects of foreign
currency translation differences, acquisitions and
disposals of subsidiaries and businesses, and fair
value movements on own debt attributable to credit
spread where the net result of such movements will
be zero upon maturity of the debt; all of which
distort year-on-year comparisons. We refer to this
as our underlying performance.
Reported results include the effects of the above
items. They are excluded when monitoring progress
against operating plans and past results because
management believes that the underlying basis more
accurately reflects operating performance.
Constant currency
Constant currency comparatives for 2009 referred to in the
commentaries are computed by retranslating into US dollars
for non-US dollar branches, subsidiaries, joint ventures and
associates:
• the income statements for 2009 at the average rates of
exchange for 2010; and
• the balance sheet at 31 December 2009 at the prevailing
rates of exchange on 31 December 2010.
No adjustment has been made to the exchange rates used to
translate foreign currency denominated assets and liabilities
into the functional currencies of any HSBC branches,
subsidiaries, joint ventures or associates. When reference is
made to ‘constant currency’ in tables or commentaries,
comparative data reported in the functional currencies of
HSBC’s operations have been translated at the appropriate
exchange rates applied in the current period on the basis
described above.
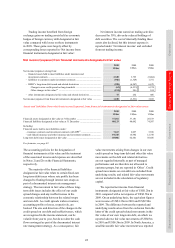
Underlying performance
The tables below compare our underlying
performance in 2010 and 2009 with reported profits
in those years.
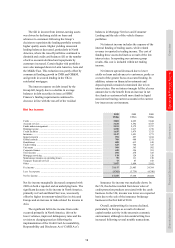
The foreign currency translation differences
reflect the relative strengthening of the US dollar
against the euro and sterling, which offset its relative
weakness against currencies in Asia, Mexico and
Brazil during 2010.
The following acquisitions and disposals
affected both comparisons:
• the acquisition of PT Bank Ekonomi Raharja
Tbk (‘Bank Ekonomi’) in May 2009;
• the gain on sale of our 49% interest in a joint
venture for a UK merchant acquiring business in
June 2009 of US$280m;
• the gain of US$62m on reclassification of Bao
Viet Holdings (‘Bao Viet’) from an available-
for-sale asset to an associate in January 2010;
• the gain on sale of our stake in Wells Fargo
HSBC Trade Bank in March 2010 of US$66m;
• the gain on disposal of HSBC Insurance Brokers
Limited of US$107m in April 2010;
• the dilution gain of US$188m which arose
on our holding in Ping An Insurance (Group)
Company of China, Limited (‘Ping An
Insurance’) following the issue of shares by the
company in May 2010;
• the loss of US$42m on the completion of the
sale of our investment in British Arab
Commercial Bank plc in October 2010;
• the gain on sale of Eversholt Rail Group of
US$255m in December 2010; and
• the gain of US$74m on the deconsolidation of
private equity funds following the management
buy-out of Headland Capital Partners Ltd
(formally known as HSBC Private Equity (Asia)
Ltd) in November 2010.