HSBC 2010 Annual Report Download - page 49
Download and view the complete annual report
Please find page 49 of the 2010 HSBC annual report below. You can navigate through the pages in the report by either clicking on the pages listed below, or by using the keyword search tool below to find specific information within the annual report.-
 1
1 -
2
-
3
-
4
-
5
-
6
-
7
-
8
-
9
-
10
-
11
-
12
-
13
-
14
-
15
-
16
-
17
-
18
-
19
-
20
-
21
-
22
-
23
-
24
-
25
-
26
-
27
-
28
-
29
-
30
-
31
-
32
-
33
-
34
-
35
-
36
-
37
-
38
-
 39
39 -
 40
40 -
 41
41 -
 42
42 -
 43
43 -
 44
44 -
 45
45 -
 46
46 -
 47
47 -
 48
48 -
 49
49 -
 50
50 -
 51
51 -
 52
52 -
 53
53 -
 54
54 -
 55
55 -
 56
56 -
 57
57 -
 58
58 -
 59
59 -
60
-
61
-
62
-
63
-
64
-
65
-
66
-
67
-
68
-
69
-
70
-
71
-
72
-
73
-
74
-
75
-
76
-
77
-
78
-
79
-
80
-
81
-
82
-
83
-
84
-
85
-
86
-
87
-
88
-
89
-
90
-
91
-
92
-
93
-
94
-
95
-
96
-
97
-
98
-
99
-
100
-
101
-
102
-
103
-
104
-
105
-
106
-
107
-
108
-
109
-
110
-
111
-
112
-
113
-
114
-
115
-
116
-
117
-
118
-
119
-
120
-
121
-
122
-
123
-
124
-
125
-
126
-
127
-
128
-
129
-
130
-
131
-
132
-
133
-
134
-
135
-
136
-
137
-
138
-
139
-
140
-
141
-
142
-
143
-
144
-
145
-
146
-
147
-
148
-
149
-
150
-
151
-
152
-
153
-
154
-
155
-
156
-
157
-
158
-
159
-
160
-
161
-
162
-
163
-
164
-
165
-
166
-
167
-
168
-
169
-
170
-
171
-
172
-
173
-
174
-
175
-
176
-
177
-
178
-
179
-
180
-
181
-
182
-
183
-
184
-
185
-
186
-
187
-
188
-
189
-
190
-
191
-
192
-
193
-
194
-
195
-
196
-
197
-
198
-
199
-
200
-
201
-
202
-
203
-
204
-
205
-
206
-
207
-
208
-
209
-
210
-
211
-
212
-
213
-
214
-
215
-
216
-
217
-
218
-
219
-
220
-
221
-
222
-
223
-
224
-
225
-
226
-
227
-
228
-
229
-
230
-
231
-
232
-
233
-
234
-
235
-
236
-
237
-
238
-
239
-
240
-
241
-
242
-
243
-
244
-
245
-
246
-
247
-
248
-
249
-
250
-
251
-
252
-
253
-
254
-
255
-
256
-
257
-
258
-
259
-
260
-
261
-
262
-
263
-
264
-
265
-
266
-
267
-
268
-
269
-
270
-
271
-
272
-
273
-
274
-
275
-
276
-
277
-
278
-
279
-
280
-
281
-
282
-
283
-
284
-
285
-
286
-
287
-
288
-
289
-
290
-
291
-
292
-
293
-
294
-
295
-
296
-
297
-
298
-
299
-
300
-
301
-
302
-
303
-
304
-
305
-
306
-
307
-
308
-
309
-
310
-
311
-
312
-
313
-
314
-
315
-
316
-
317
-
318
-
319
-
320
-
321
-
322
-
323
-
324
-
325
-
326
-
327
-
328
-
329
-
330
-
331
-
332
-
333
-
334
-
335
-
336
-
337
-
338
-
339
-
340
-
341
-
342
-
343
-
344
-
345
-
346
-
347
-
348
-
349
-
350
-
351
-
352
-
353
-
354
-
355
-
356
-
357
-
358
-
359
-
360
-
361
-
362
-
363
-
364
-
365
-
366
-
367
-
368
-
369
-
370
-
371
-
372
-
373
-
374
-
375
-
376
-
377
-
378
-
379
-
380
-
381
-
382
-
383
-
384
-
385
-
386
-
387
-
388
-
389
-
390
-
391
-
392
-
393
-
394
-
395
-
396
 |
 |

47
Overview Operating & Financial Review Governance Financial Statements Shareholder Information
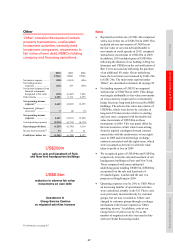
Other
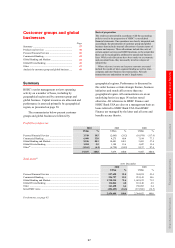
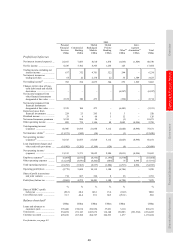
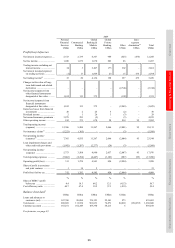
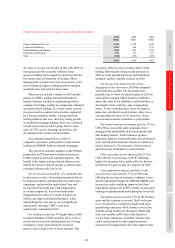
‘Other’ contains the results of certain
property transactions, unallocated
investment activities, centrally held
investment companies, movements in
fair value of own debt, HSBC’s holding
company and financing operations.
2010 2009 2008
US$m US$m US$m
Net interest expense .......... (998) (1,035) (956)
Net trading income/
(expense) ........................ (311) 279 (530)
Net income/(expense) from
financial instruments
designated at fair value .. (216) (6,443) 7,426
Other income .................... 6,185 5,176 6,355
Net operating income/
(expense)46 ..................... 4,660 (2,023) 12,295
Impairment (charges)/
recoveries47 .................... 3 (8) (5)
Net operating income/
(expense) ....................... 4,663 (2,031) 12,290
Total operating expenses .. (5,918) (4,715) (4,174)
Operating profit/(loss) .... (1,255) (6,746) 8,116
Income from associates48 .. 94 26 41
Profit/(loss) before tax .... (1,161) (6,720) 8,157
US$250m
gain on sale and leaseback of Paris
and New York headquarters buildings
US$6.5bn
reduction in adverse fair value
movements on own debt
Investment in
Group Service Centres
as migrated activities increase
For footnotes, see page 83.
Notes
• Reported loss before tax of US$1.2bn compared
with a loss before tax of US$6.7bn in 2009. This
included adverse movements of US$63m on
the fair value of our own debt attributable to
movements in credit spreads in 2010, compared
with adverse movements of US$6.5bn in 2009.
In addition, 2010 included gains of US$188m
following the dilution of our holding in Ping An
Insurance and US$62m on the reclassification of
Bao Viet to an associate following the purchase
of an additional 8% stake. On an underlying
basis, the loss before tax increased by US$1.2bn
to US$1.3bn. The main items reported under
‘Other’, are described in footnote 44 on page 85.
• Net trading expense of US$311m compared
with income of US$276m in 2009. This change
was largely attributable to fair value movements
on cross-currency swaps used to economically
hedge fixed rate long-term debt issued by HSBC
Holdings. The adverse fair value movements of
US$304m, which were driven by a decline in
long-term US interest rates relative to sterling
and euro rates, compared with favourable fair
value movements of US$748m on these
instruments in 2009. This was partly offset by
the non-recurrence of fair value losses arising
from the implied contingent forward contract
entered into with the underwriters of our rights
issue in 2009 and forward foreign exchange
contracts associated with the rights issue, which
were accounted as derivatives with fair value
taken to profit or loss in 2009.
• We recognised gains of US$194m and US$56m,
respectively, from the sale and leaseback of our
headquarters buildings in Paris and New York.
These compared with more substantial
underlying gains totalling US$667m (US$686m
as reported) on the sale and leaseback of
8 Canada Square, London and the sale of a
property in Hong Kong in 2009.
• Operating expenses rose by 24% to US$5.9bn as
an increasing number of operational activities
were centralised, notably in the US. These costs
were previously incurred directly by customer
groups, but are now recorded in ‘Other’ and
charged to customer groups through a recharge
mechanism with income reported as ‘Other
operating income’. In addition, costs at our
Group Service Centres rose by 6% as the
number of migrated activities increased in line
with our Global Resourcing model.