HSBC 2010 Annual Report Download - page 67
Download and view the complete annual report
Please find page 67 of the 2010 HSBC annual report below. You can navigate through the pages in the report by either clicking on the pages listed below, or by using the keyword search tool below to find specific information within the annual report.-
 1
1 -
2
-
3
-
4
-
5
-
6
-
7
-
8
-
9
-
10
-
11
-
12
-
13
-
14
-
15
-
16
-
17
-
18
-
19
-
20
-
21
-
22
-
23
-
24
-
25
-
26
-
27
-
28
-
29
-
30
-
31
-
32
-
33
-
34
-
35
-
36
-
37
-
38
-
39
-
40
-
41
-
42
-
43
-
44
-
45
-
46
-
47
-
48
-
49
-
50
-
51
-
52
-
53
-
54
-
55
-
56
-
 57
57 -
 58
58 -
 59
59 -
 60
60 -
 61
61 -
 62
62 -
 63
63 -
 64
64 -
 65
65 -
 66
66 -
 67
67 -
 68
68 -
 69
69 -
 70
70 -
 71
71 -
 72
72 -
 73
73 -
 74
74 -
 75
75 -
 76
76 -
 77
77 -
78
-
79
-
80
-
81
-
82
-
83
-
84
-
85
-
86
-
87
-
88
-
89
-
90
-
91
-
92
-
93
-
94
-
95
-
96
-
97
-
98
-
99
-
100
-
101
-
102
-
103
-
104
-
105
-
106
-
107
-
108
-
109
-
110
-
111
-
112
-
113
-
114
-
115
-
116
-
117
-
118
-
119
-
120
-
121
-
122
-
123
-
124
-
125
-
126
-
127
-
128
-
129
-
130
-
131
-
132
-
133
-
134
-
135
-
136
-
137
-
138
-
139
-
140
-
141
-
142
-
143
-
144
-
145
-
146
-
147
-
148
-
149
-
150
-
151
-
152
-
153
-
154
-
155
-
156
-
157
-
158
-
159
-
160
-
161
-
162
-
163
-
164
-
165
-
166
-
167
-
168
-
169
-
170
-
171
-
172
-
173
-
174
-
175
-
176
-
177
-
178
-
179
-
180
-
181
-
182
-
183
-
184
-
185
-
186
-
187
-
188
-
189
-
190
-
191
-
192
-
193
-
194
-
195
-
196
-
197
-
198
-
199
-
200
-
201
-
202
-
203
-
204
-
205
-
206
-
207
-
208
-
209
-
210
-
211
-
212
-
213
-
214
-
215
-
216
-
217
-
218
-
219
-
220
-
221
-
222
-
223
-
224
-
225
-
226
-
227
-
228
-
229
-
230
-
231
-
232
-
233
-
234
-
235
-
236
-
237
-
238
-
239
-
240
-
241
-
242
-
243
-
244
-
245
-
246
-
247
-
248
-
249
-
250
-
251
-
252
-
253
-
254
-
255
-
256
-
257
-
258
-
259
-
260
-
261
-
262
-
263
-
264
-
265
-
266
-
267
-
268
-
269
-
270
-
271
-
272
-
273
-
274
-
275
-
276
-
277
-
278
-
279
-
280
-
281
-
282
-
283
-
284
-
285
-
286
-
287
-
288
-
289
-
290
-
291
-
292
-
293
-
294
-
295
-
296
-
297
-
298
-
299
-
300
-
301
-
302
-
303
-
304
-
305
-
306
-
307
-
308
-
309
-
310
-
311
-
312
-
313
-
314
-
315
-
316
-
317
-
318
-
319
-
320
-
321
-
322
-
323
-
324
-
325
-
326
-
327
-
328
-
329
-
330
-
331
-
332
-
333
-
334
-
335
-
336
-
337
-
338
-
339
-
340
-
341
-
342
-
343
-
344
-
345
-
346
-
347
-
348
-
349
-
350
-
351
-
352
-
353
-
354
-
355
-
356
-
357
-
358
-
359
-
360
-
361
-
362
-
363
-
364
-
365
-
366
-
367
-
368
-
369
-
370
-
371
-
372
-
373
-
374
-
375
-
376
-
377
-
378
-
379
-
380
-
381
-
382
-
383
-
384
-
385
-
386
-
387
-
388
-
389
-
390
-
391
-
392
-
393
-
394
-
395
-
396
 |
 |

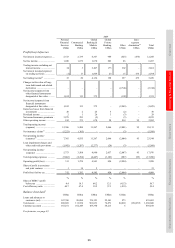
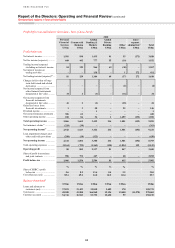
65
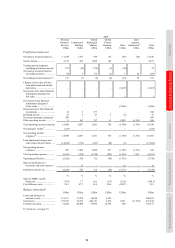
Overview Operating & Financial Review Governance Financial Statements Shareholder Information
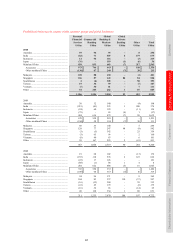
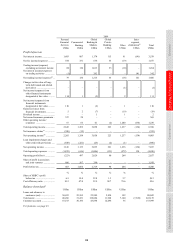
2009
Personal
Financial
Services
US$m
Commercial
Banking
US$m
Global
Banking &
Markets
US$m
Global
Private
Banking
US$m
Other
US$m
Inter-
segment
elimination56
US$m
Total
US$m
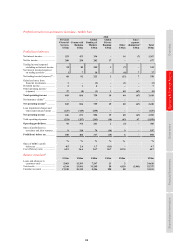
Profit before tax
Net interest income ..................... 1,493 807 1,174 115 91 (141) 3,539
Net fee income/(expense) ........... 554 331 636 55 (19) – 1,557
Trading income/(expense)
excluding net interest income 80 134 1,013 55 (18) – 1,264
Net interest income/(expense)
on trading activities ................ (1) – 202 – – 141 342
Net trading income/(expense)49 .. 79 134 1,215 55 (18) 141 1,606
Changes in fair value of long-
term debt issued and related
derivatives .............................. – – – – (1) – (1)
Net income/(expense) from
other financial instruments
designated at fair value ........... 110 1 (2) – 2 – 111
Net income/(expense) from
financial instruments
designated at fair value ........... 110 1 (2) – 1 – 110
Gains less losses from
financial investments .............. 5 2 (7) – (19) – (19)
Dividend income ......................... – – 1 – 1 – 2
Net earned insurance premiums . 337 28 – – – – 365
Other operating income/
(expense) ................................ 67 66 41 (2) 1,200 (134) 1,238
Total operating income ............... 2,645 1,369 3,058 223 1,237 (134) 8,398
Net insurance claims57 ................ (380) (15) – – – – (395)
Net operating income46 ............... 2,265 1,354 3,058 223 1,237 (134) 8,003
Loan impairment charges and
other credit risk provisions ..... (649) (221) (23) (2) (1) – (896)
Net operating income ................. 1,616 1,133 3,035 221 1,236 (134) 7,107
Total operating expenses ............ (1,839) (636) (1,006) (131) (972) 134 (4,450)
Operating profit/(loss) ................ (223) 497 2,029 90 264 – 2,657
Share of profit in associates
and joint ventures ................... 686 567 290 – – – 1,543
Profit before tax .......................... 463 1,064 2,319 90 264 – 4,200
% % % % % %
Share of HSBC’s profit
before tax ................................ 6.5 15.0 32.8 1.3 3.7 59.3
Cost efficiency ratio ................... 81.2 47.0 32.9 58.7 78.6 55.6
Balance sheet data45
US$m US$m US$m US$m US$m US$m
Loans and advances to
customers (net) ....................... 30,433 22,595 23,989 2,834 192 80,043
Total assets ................................. 40,266 31,221 138,884 11,928 7,160 (7,320) 222,139
Customer accounts ...................... 47,573 30,196 43,698 12,496 36 133,999
For footnotes, see page 83.