HSBC 2010 Annual Report Download - page 121
Download and view the complete annual report
Please find page 121 of the 2010 HSBC annual report below. You can navigate through the pages in the report by either clicking on the pages listed below, or by using the keyword search tool below to find specific information within the annual report.-
 1
1 -
2
-
3
-
4
-
5
-
6
-
7
-
8
-
9
-
10
-
11
-
12
-
13
-
14
-
15
-
16
-
17
-
18
-
19
-
20
-
21
-
22
-
23
-
24
-
25
-
26
-
27
-
28
-
29
-
30
-
31
-
32
-
33
-
34
-
35
-
36
-
37
-
38
-
39
-
40
-
41
-
42
-
43
-
44
-
45
-
46
-
47
-
48
-
49
-
50
-
51
-
52
-
53
-
54
-
55
-
56
-
57
-
58
-
59
-
60
-
61
-
62
-
63
-
64
-
65
-
66
-
67
-
68
-
69
-
70
-
71
-
72
-
73
-
74
-
75
-
76
-
77
-
78
-
79
-
80
-
81
-
82
-
83
-
84
-
85
-
86
-
87
-
88
-
89
-
90
-
91
-
92
-
93
-
94
-
95
-
96
-
97
-
98
-
99
-
100
-
101
-
102
-
103
-
104
-
105
-
106
-
107
-
108
-
109
-
110
-
 111
111 -
 112
112 -
 113
113 -
 114
114 -
 115
115 -
 116
116 -
 117
117 -
 118
118 -
 119
119 -
 120
120 -
 121
121 -
 122
122 -
 123
123 -
 124
124 -
 125
125 -
 126
126 -
 127
127 -
 128
128 -
 129
129 -
 130
130 -
 131
131 -
132
-
133
-
134
-
135
-
136
-
137
-
138
-
139
-
140
-
141
-
142
-
143
-
144
-
145
-
146
-
147
-
148
-
149
-
150
-
151
-
152
-
153
-
154
-
155
-
156
-
157
-
158
-
159
-
160
-
161
-
162
-
163
-
164
-
165
-
166
-
167
-
168
-
169
-
170
-
171
-
172
-
173
-
174
-
175
-
176
-
177
-
178
-
179
-
180
-
181
-
182
-
183
-
184
-
185
-
186
-
187
-
188
-
189
-
190
-
191
-
192
-
193
-
194
-
195
-
196
-
197
-
198
-
199
-
200
-
201
-
202
-
203
-
204
-
205
-
206
-
207
-
208
-
209
-
210
-
211
-
212
-
213
-
214
-
215
-
216
-
217
-
218
-
219
-
220
-
221
-
222
-
223
-
224
-
225
-
226
-
227
-
228
-
229
-
230
-
231
-
232
-
233
-
234
-
235
-
236
-
237
-
238
-
239
-
240
-
241
-
242
-
243
-
244
-
245
-
246
-
247
-
248
-
249
-
250
-
251
-
252
-
253
-
254
-
255
-
256
-
257
-
258
-
259
-
260
-
261
-
262
-
263
-
264
-
265
-
266
-
267
-
268
-
269
-
270
-
271
-
272
-
273
-
274
-
275
-
276
-
277
-
278
-
279
-
280
-
281
-
282
-
283
-
284
-
285
-
286
-
287
-
288
-
289
-
290
-
291
-
292
-
293
-
294
-
295
-
296
-
297
-
298
-
299
-
300
-
301
-
302
-
303
-
304
-
305
-
306
-
307
-
308
-
309
-
310
-
311
-
312
-
313
-
314
-
315
-
316
-
317
-
318
-
319
-
320
-
321
-
322
-
323
-
324
-
325
-
326
-
327
-
328
-
329
-
330
-
331
-
332
-
333
-
334
-
335
-
336
-
337
-
338
-
339
-
340
-
341
-
342
-
343
-
344
-
345
-
346
-
347
-
348
-
349
-
350
-
351
-
352
-
353
-
354
-
355
-
356
-
357
-
358
-
359
-
360
-
361
-
362
-
363
-
364
-
365
-
366
-
367
-
368
-
369
-
370
-
371
-
372
-
373
-
374
-
375
-
376
-
377
-
378
-
379
-
380
-
381
-
382
-
383
-
384
-
385
-
386
-
387
-
388
-
389
-
390
-
391
-
392
-
393
-
394
-
395
-
396
 |
 |
119
Overview Operating & Financial Review Governance Financial Statements Shareholder Information
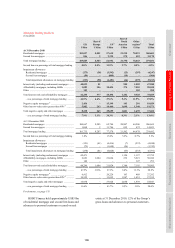
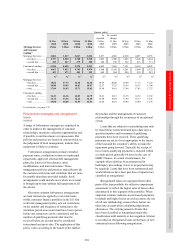
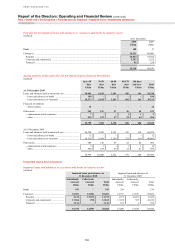
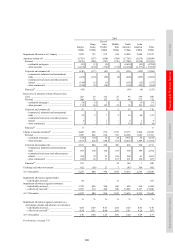
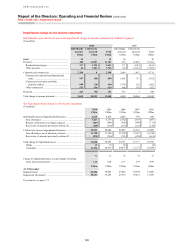
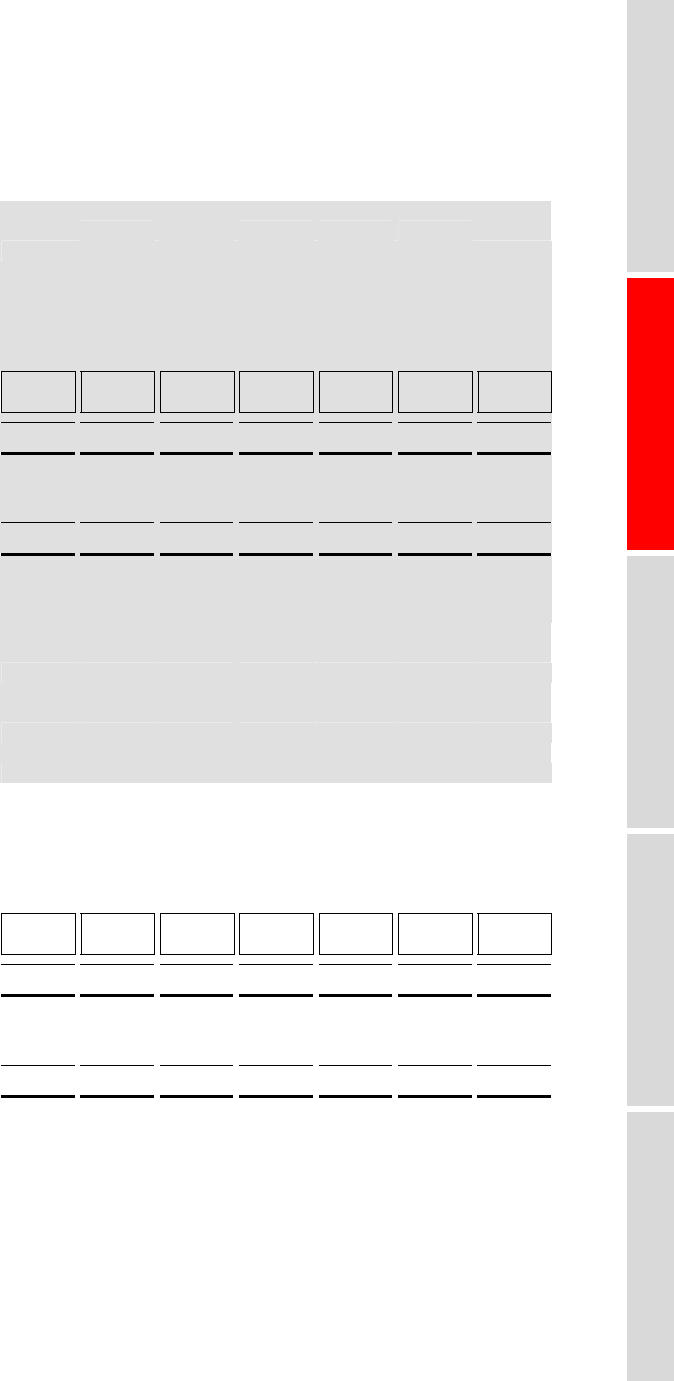
Impairment allowances on loans and
advances to customers and banks
(Audited)
The tables below analyse by geographical region the
impairment allowances recognised for impaired
loans and advances that are either individually
assessed or collectively assessed, and collective
impairment allowances on loans and advances
classified as not impaired.
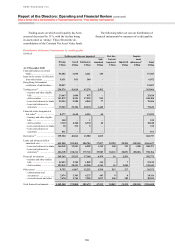
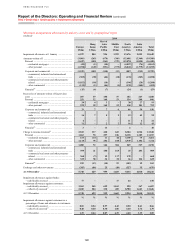
Impairment allowances on loans and advances to customers by geographical region
(Audited)
Europe
Hong
Kong
Rest of
Asia-
Pacific
Middle
East
North
America
Latin
America Total
US$m US$m US$m US$m US$m US$m US$m
At 31 December 2010
Gross loans and advances
Individually assessed impaired loans30 ..................... 8,831 637 1,185 2,137 1,632 779 15,201
Collectively assessed31 ............................................. 432,631 140,683 108,505 24,141 198,070 59,218 963,248
Impaired loans30 ................................................... 1,726 23 139 296 9,095 1,611 12,890
Non-impaired loans32 ........................................... 430,905 140,660 108,366 23,845 188,975 57,607 950,358
Total gross loans and advances ................................ 441,462 141,320 109,690 26,278 199,702 59,997 978,449
Impairment allowances
Individually assessed ............................................ 3,563 345 629 1,163 390 367 6,457
Collectively assessed ............................................ 2,100 284 330 489 8,780 1,643 13,626
Total impairment allowances ................................... 5,663 629 959 1,652 9,170 2,010 20,083
Net loans and advances ............................................ 435,799 140,691 108,731 24,626 190,532 57,987 958,366
% % % % % % %
Individually assessed allowances as a
percentage of individually assessed loans
and advances ........................................................ 40.3 54.2 53.1 54.4 23.9 47.1 42.5
Collectively assessed allowances as a
percentage of collectively assessed loans
and advances ........................................................ 0.5 0.2 0.3 2.0 4.4 2.8 1.4
Total allowances as a percentage of total
gross loans and advances ..................................... 1.3 0.4 0.9 6.3 4.6 3.4 2.1
US$m US$m US$m US$m US$m US$m US$m
At 31 December 2009
Gross loans and advances
Individually assessed impaired loans30 ..................... 8,800 823 1,006 1,310 1,990 838 14,767
Collectively assessed31 .............................................. 436,816 99,362 80,033 22,912 218,539 49,344 907,006
Impaired loans30 ................................................... 1,922 18 194 336 11,256 2,113 15,839
Non-impaired loans32 ........................................... 434,894 99,344 79,839 22,576 207,283 47,231 891,167
Total gross loans and advances ................................ 445,616 100,185 81,039 24,222 220,529 50,182 921,773
Impairment allowances
Individually assessed ............................................ 3,742 490 508 688 650 416 6,494
Collectively assessed ............................................ 2,393 314 488 690 13,026 2,137 19,048
Total impairment allowances ................................... 6,135 804 996 1,378 13,676 2,553 25,542
Net loans and advances ............................................ 439,481 99,381 80,043 22,844 206,853 47,629 896,231
% % % % % % %
Individually assessed allowances as a
percentage of individually assessed loans
and advances ........................................................ 42.5 59.5 50.5 52.5 32.7 49.7 44.0
Collectively assessed allowances as a
percentage of collectively assessed loans
and advances ........................................................ 0.5 0.3 0.6 3.0 6.0 4.3 2.1
Total allowances as a percentage of total
gross loans and advances ..................................... 1.4 0.8 1.2 5.7 6.2 5.1 2.8
For footnotes, see page 174.