HSBC 2010 Annual Report Download - page 127
Download and view the complete annual report
Please find page 127 of the 2010 HSBC annual report below. You can navigate through the pages in the report by either clicking on the pages listed below, or by using the keyword search tool below to find specific information within the annual report.-
 1
1 -
2
-
3
-
4
-
5
-
6
-
7
-
8
-
9
-
10
-
11
-
12
-
13
-
14
-
15
-
16
-
17
-
18
-
19
-
20
-
21
-
22
-
23
-
24
-
25
-
26
-
27
-
28
-
29
-
30
-
31
-
32
-
33
-
34
-
35
-
36
-
37
-
38
-
39
-
40
-
41
-
42
-
43
-
44
-
45
-
46
-
47
-
48
-
49
-
50
-
51
-
52
-
53
-
54
-
55
-
56
-
57
-
58
-
59
-
60
-
61
-
62
-
63
-
64
-
65
-
66
-
67
-
68
-
69
-
70
-
71
-
72
-
73
-
74
-
75
-
76
-
77
-
78
-
79
-
80
-
81
-
82
-
83
-
84
-
85
-
86
-
87
-
88
-
89
-
90
-
91
-
92
-
93
-
94
-
95
-
96
-
97
-
98
-
99
-
100
-
101
-
102
-
103
-
104
-
105
-
106
-
107
-
108
-
109
-
110
-
111
-
112
-
113
-
114
-
115
-
116
-
 117
117 -
 118
118 -
 119
119 -
 120
120 -
 121
121 -
 122
122 -
 123
123 -
 124
124 -
 125
125 -
 126
126 -
 127
127 -
 128
128 -
 129
129 -
 130
130 -
 131
131 -
 132
132 -
 133
133 -
 134
134 -
 135
135 -
 136
136 -
 137
137 -
138
-
139
-
140
-
141
-
142
-
143
-
144
-
145
-
146
-
147
-
148
-
149
-
150
-
151
-
152
-
153
-
154
-
155
-
156
-
157
-
158
-
159
-
160
-
161
-
162
-
163
-
164
-
165
-
166
-
167
-
168
-
169
-
170
-
171
-
172
-
173
-
174
-
175
-
176
-
177
-
178
-
179
-
180
-
181
-
182
-
183
-
184
-
185
-
186
-
187
-
188
-
189
-
190
-
191
-
192
-
193
-
194
-
195
-
196
-
197
-
198
-
199
-
200
-
201
-
202
-
203
-
204
-
205
-
206
-
207
-
208
-
209
-
210
-
211
-
212
-
213
-
214
-
215
-
216
-
217
-
218
-
219
-
220
-
221
-
222
-
223
-
224
-
225
-
226
-
227
-
228
-
229
-
230
-
231
-
232
-
233
-
234
-
235
-
236
-
237
-
238
-
239
-
240
-
241
-
242
-
243
-
244
-
245
-
246
-
247
-
248
-
249
-
250
-
251
-
252
-
253
-
254
-
255
-
256
-
257
-
258
-
259
-
260
-
261
-
262
-
263
-
264
-
265
-
266
-
267
-
268
-
269
-
270
-
271
-
272
-
273
-
274
-
275
-
276
-
277
-
278
-
279
-
280
-
281
-
282
-
283
-
284
-
285
-
286
-
287
-
288
-
289
-
290
-
291
-
292
-
293
-
294
-
295
-
296
-
297
-
298
-
299
-
300
-
301
-
302
-
303
-
304
-
305
-
306
-
307
-
308
-
309
-
310
-
311
-
312
-
313
-
314
-
315
-
316
-
317
-
318
-
319
-
320
-
321
-
322
-
323
-
324
-
325
-
326
-
327
-
328
-
329
-
330
-
331
-
332
-
333
-
334
-
335
-
336
-
337
-
338
-
339
-
340
-
341
-
342
-
343
-
344
-
345
-
346
-
347
-
348
-
349
-
350
-
351
-
352
-
353
-
354
-
355
-
356
-
357
-
358
-
359
-
360
-
361
-
362
-
363
-
364
-
365
-
366
-
367
-
368
-
369
-
370
-
371
-
372
-
373
-
374
-
375
-
376
-
377
-
378
-
379
-
380
-
381
-
382
-
383
-
384
-
385
-
386
-
387
-
388
-
389
-
390
-
391
-
392
-
393
-
394
-
395
-
396
 |
 |
125
Overview Operating & Financial Review Governance Financial Statements Shareholder Information
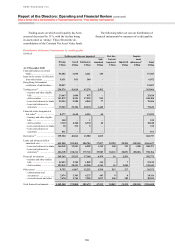
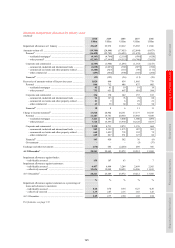
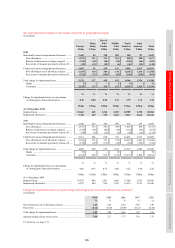
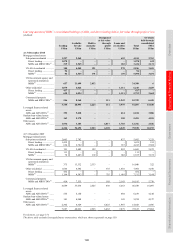
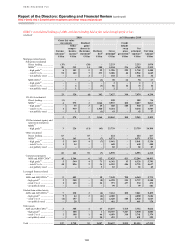
Net loan impairment charge to the income statement by geographical region
(Unaudited)
Europe
Hong
Kong
Rest of
Asia-
Pacific
Middle
East
North
America
Latin
America Total
US$m US$m US$m US$m US$m US$m US$m
2010
Individually assessed impairment allowances ......... 1,445 45 198 502 348 87 2,625
New allowances .................................................... 1,874 111 311 561 580 180 3,617
Release of allowances no longer required ........... (394) (54) (84) (55) (196) (64) (847)
Recoveries of amounts previously written off ..... (35) (12) (29) (4) (36) (29) (145)
Collectively assessed impairment allowances ......... 1,087 92 230 121 7,956 1,437 10,923
New allowances net of allowance releases .......... 1,339 119 389 174 8,102 1,675 11,798
Recoveries of amounts previously written off ..... (252) (27) (159) (53) (146) (238) (875)
Total charge for impairment losses .......................... 2,532 137 428 623 8,304 1,524 13,548
Banks ................................................................... 2––28 – 12
Customers ............................................................ 2,530 137 428 621 8,296 1,524 13,536
% % % % % % %
Charge for impairment losses as a percentage
of closing gross loans and advances .................... 0.49 0.08 0.29 1.75 3.79 1.74 1.14
US$m US$m US$m US$m US$m US$m US$m
At 31 December 2010
Impaired loans .......................................................... 10,663 665 1,324 2,453 10,789 2,390 28,284
Impairment allowances ............................................. 5,740 629 959 1,669 9,234 2,010 20,241
2009
Individually assessed impairment allowances ......... 2,248 242 244 580 916 228 4,458
New allowances .................................................... 2,573 315 341 598 1,052 294 5,173
Release of allowances no longer required ........... (255) (64) (82) (16) (112) (52) (581)
Recoveries of amounts previously written off ..... (70) (9) (15) (2) (24) (14) (134)
Collectively assessed impairment allowances ......... 2,161 208 630 753 14,456 2,276 20,484
New allowances net of allowance releases .......... 2,356 233 747 778 14,525 2,601 21,240
Recoveries of amounts previously written off ..... (195) (25) (117) (25) (69) (325) (756)
Total charge for impairment losses .......................... 4,409 450 874 1,333 15,372 2,504 24,942
Banks ................................................................... 55 – – 15 – – 70
Customers ............................................................ 4,354 450 874 1,318 15,372 2,504 24,872
% % % % % % %
Charge for impairment losses as a percentage
of closing gross loans and advances .................... 0.86 0.33 0.75 4.08 6.52 3.64 2.26
US$m US$m US$m US$m US$m US$m US$m
At 31 December 2009
Impaired loans .......................................................... 10,873 846 1,201 1,666 13,308 2,951 30,845
Impairment allowances ............................................. 6,227 804 996 1,393 13,676 2,553 25,649
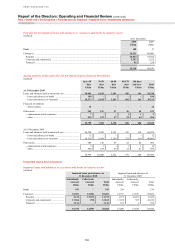
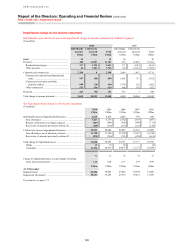
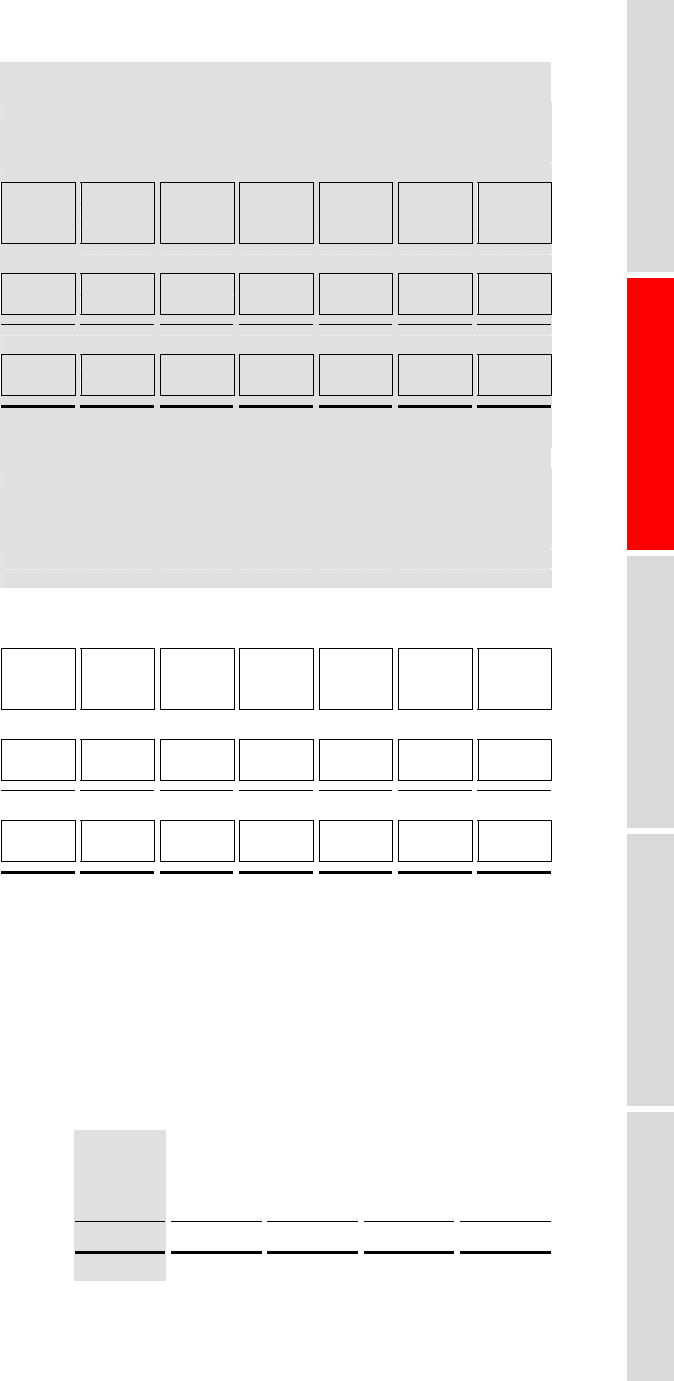
Charge for impairment losses as a percentage of average gross loans and advances to customers2
(Unaudited)
2010
2009 2008 2007 2006
% % % % %
New allowances net of allowance releases ................................. 1.65 2.92 2.54 2.09 1.49
Recoveries ................................................................................... (0.12) (0.10) (0.09) (0.12) (0.10)
Total charge for impairment losses ............................................. 1.53 2.82 2.45 1.97 1.39
Amount written off net of recoveries .......................................... 2.08 2.71 1.75 1.36 1.15
For footnote, see page 174.