HSBC 2010 Annual Report Download - page 301
Download and view the complete annual report
Please find page 301 of the 2010 HSBC annual report below. You can navigate through the pages in the report by either clicking on the pages listed below, or by using the keyword search tool below to find specific information within the annual report.-
 1
1 -
2
-
3
-
4
-
5
-
6
-
7
-
8
-
9
-
10
-
11
-
12
-
13
-
14
-
15
-
16
-
17
-
18
-
19
-
20
-
21
-
22
-
23
-
24
-
25
-
26
-
27
-
28
-
29
-
30
-
31
-
32
-
33
-
34
-
35
-
36
-
37
-
38
-
39
-
40
-
41
-
42
-
43
-
44
-
45
-
46
-
47
-
48
-
49
-
50
-
51
-
52
-
53
-
54
-
55
-
56
-
57
-
58
-
59
-
60
-
61
-
62
-
63
-
64
-
65
-
66
-
67
-
68
-
69
-
70
-
71
-
72
-
73
-
74
-
75
-
76
-
77
-
78
-
79
-
80
-
81
-
82
-
83
-
84
-
85
-
86
-
87
-
88
-
89
-
90
-
91
-
92
-
93
-
94
-
95
-
96
-
97
-
98
-
99
-
100
-
101
-
102
-
103
-
104
-
105
-
106
-
107
-
108
-
109
-
110
-
111
-
112
-
113
-
114
-
115
-
116
-
117
-
118
-
119
-
120
-
121
-
122
-
123
-
124
-
125
-
126
-
127
-
128
-
129
-
130
-
131
-
132
-
133
-
134
-
135
-
136
-
137
-
138
-
139
-
140
-
141
-
142
-
143
-
144
-
145
-
146
-
147
-
148
-
149
-
150
-
151
-
152
-
153
-
154
-
155
-
156
-
157
-
158
-
159
-
160
-
161
-
162
-
163
-
164
-
165
-
166
-
167
-
168
-
169
-
170
-
171
-
172
-
173
-
174
-
175
-
176
-
177
-
178
-
179
-
180
-
181
-
182
-
183
-
184
-
185
-
186
-
187
-
188
-
189
-
190
-
191
-
192
-
193
-
194
-
195
-
196
-
197
-
198
-
199
-
200
-
201
-
202
-
203
-
204
-
205
-
206
-
207
-
208
-
209
-
210
-
211
-
212
-
213
-
214
-
215
-
216
-
217
-
218
-
219
-
220
-
221
-
222
-
223
-
224
-
225
-
226
-
227
-
228
-
229
-
230
-
231
-
232
-
233
-
234
-
235
-
236
-
237
-
238
-
239
-
240
-
241
-
242
-
243
-
244
-
245
-
246
-
247
-
248
-
249
-
250
-
251
-
252
-
253
-
254
-
255
-
256
-
257
-
258
-
259
-
260
-
261
-
262
-
263
-
264
-
265
-
266
-
267
-
268
-
269
-
270
-
271
-
272
-
273
-
274
-
275
-
276
-
277
-
278
-
279
-
280
-
281
-
282
-
283
-
284
-
285
-
286
-
287
-
288
-
289
-
290
-
 291
291 -
 292
292 -
 293
293 -
 294
294 -
 295
295 -
 296
296 -
 297
297 -
 298
298 -
 299
299 -
 300
300 -
 301
301 -
 302
302 -
 303
303 -
 304
304 -
 305
305 -
 306
306 -
 307
307 -
 308
308 -
 309
309 -
 310
310 -
 311
311 -
312
-
313
-
314
-
315
-
316
-
317
-
318
-
319
-
320
-
321
-
322
-
323
-
324
-
325
-
326
-
327
-
328
-
329
-
330
-
331
-
332
-
333
-
334
-
335
-
336
-
337
-
338
-
339
-
340
-
341
-
342
-
343
-
344
-
345
-
346
-
347
-
348
-
349
-
350
-
351
-
352
-
353
-
354
-
355
-
356
-
357
-
358
-
359
-
360
-
361
-
362
-
363
-
364
-
365
-
366
-
367
-
368
-
369
-
370
-
371
-
372
-
373
-
374
-
375
-
376
-
377
-
378
-
379
-
380
-
381
-
382
-
383
-
384
-
385
-
386
-
387
-
388
-
389
-
390
-
391
-
392
-
393
-
394
-
395
-
396
 |
 |

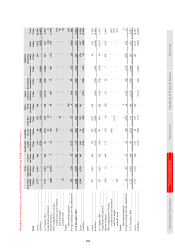
299
Overview Operating & Financial Review Governance Financial Statements Shareholder Information
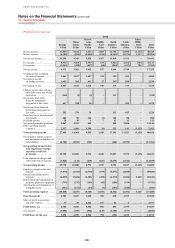
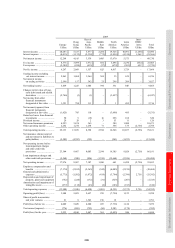
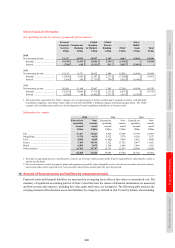
2009
Europe
Hong
Kong
Rest of
Asia-
Pacific
Middle
East
North
America
Latin
America
Intra-
HSBC
items
Total
US$m US$m US$m US$m US$m US$m US$m US$m
Interest income ............................ 20,283 5,327 5,877 2,260 19,526 10,091 (1,268) 62,096
Interest expense .......................... (8,015) (1,132) (2,338) (775) (5,856) (4,518) 1,268 (21,366)
Net interest income ..................... 12,268 4,195 3,539 1,485 13,670 5,573 – 40,730
Fee income .................................. 8,576 3,099 1,972 682 5,496 2,230 (652) 21,403
Fee expense ................................. (2,309) (430) (415) (57) (679) (501) 652 (3,739)
Net fee income ............................ 6,267 2,669 1,557 625 4,817 1,729 – 17,664
Trading income excluding
net interest income ................. 2,861 1,068 1,264 369 35 639 – 6,236
Net interest income
on trading activities ................ 2,598 157 342 25 296 209 – 3,627
Net trading income ..................... 5,459 1,225 1,606 394 331 848 – 9,863
Changes in fair value of long-
term debt issued and related
derivatives .............................. (2,746) (3) (1) – (3,497) – – (6,247)
Net income from other
financial instruments
designated at fair value ........... 1,321 788 111 – 1 495 – 2,716
Net income/(expense) from
financial instruments
designated at fair value ........... (1,425) 785 110 – (3,496) 495 – (3,531)
Gains less losses from financial
investments ............................. 50 9 (19) 16 296 168 – 520
Dividend income ......................... 29 28 2 3 53 11 – 126
Net earned insurance premiums . 4,223 3,674 365 – 309 1,900 – 10,471
Other operating income .............. 2,262 1,274 1,238 71 566 133 (2,756) 2,788
Total operating income ............... 29,133 13,859 8,398 2,594 16,546 10,857 (2,756) 78,631
Net insurance claims incurred
and movement in liabilities to
policyholders .......................... (5,589) (4,392) (395) – (241) (1,833) – (12,450)
Net operating income before
loan impairment charges
and other credit risk
provisions ............................... 23,544 9,467 8,003 2,594 16,305 9,024 (2,756) 66,181
Loan impairment charges and
other credit risk provisions ..... (5,568) (500) (896) (1,334) (15,664) (2,526) – (26,488)
Net operating income .................. 17,976 8,967 7,107 1,260 641 6,498 (2,756) 39,693
Employee compensation and
benefits .................................. (7,174) (2,102) (2,363) (545) (4,085) (2,199) – (18,468)
General and administrative
expenses .................................. (5,775) (1,502) (1,872) (419) (3,794) (2,786) 2,756 (13,392)
Depreciation and impairment of
property, plant and equipment (762) (224) (172) (31) (329) (207) – (1,725)
Amortisation and impairment of
intangible assets ...................... (277) (118) (43) (6) (183) (183) – (810)
Total operating expenses ............ (13,988) (3,946) (4,450) (1,001) (8,391) (5,375) 2,756 (34,395)
Operating profit/(loss) ................ 3,988 5,021 2,657 259 (7,750) 1,123 – 5,298
Share of profit in associates
and joint ventures ................... 21 8 1,543 196 12 1 – 1,781
Profit/(loss) before tax ................ 4,009 5,029 4,200 455 (7,738) 1,124 – 7,079
Tax income/(expense) ................. (776) (869) (753) (94) 2,285 (178) – (385)
Profit/(loss) for the year .............. 3,233 4,160 3,447 361 (5,453) 946 – 6,694