HSBC 2010 Annual Report Download - page 297
Download and view the complete annual report
Please find page 297 of the 2010 HSBC annual report below. You can navigate through the pages in the report by either clicking on the pages listed below, or by using the keyword search tool below to find specific information within the annual report.-
 1
1 -
2
-
3
-
4
-
5
-
6
-
7
-
8
-
9
-
10
-
11
-
12
-
13
-
14
-
15
-
16
-
17
-
18
-
19
-
20
-
21
-
22
-
23
-
24
-
25
-
26
-
27
-
28
-
29
-
30
-
31
-
32
-
33
-
34
-
35
-
36
-
37
-
38
-
39
-
40
-
41
-
42
-
43
-
44
-
45
-
46
-
47
-
48
-
49
-
50
-
51
-
52
-
53
-
54
-
55
-
56
-
57
-
58
-
59
-
60
-
61
-
62
-
63
-
64
-
65
-
66
-
67
-
68
-
69
-
70
-
71
-
72
-
73
-
74
-
75
-
76
-
77
-
78
-
79
-
80
-
81
-
82
-
83
-
84
-
85
-
86
-
87
-
88
-
89
-
90
-
91
-
92
-
93
-
94
-
95
-
96
-
97
-
98
-
99
-
100
-
101
-
102
-
103
-
104
-
105
-
106
-
107
-
108
-
109
-
110
-
111
-
112
-
113
-
114
-
115
-
116
-
117
-
118
-
119
-
120
-
121
-
122
-
123
-
124
-
125
-
126
-
127
-
128
-
129
-
130
-
131
-
132
-
133
-
134
-
135
-
136
-
137
-
138
-
139
-
140
-
141
-
142
-
143
-
144
-
145
-
146
-
147
-
148
-
149
-
150
-
151
-
152
-
153
-
154
-
155
-
156
-
157
-
158
-
159
-
160
-
161
-
162
-
163
-
164
-
165
-
166
-
167
-
168
-
169
-
170
-
171
-
172
-
173
-
174
-
175
-
176
-
177
-
178
-
179
-
180
-
181
-
182
-
183
-
184
-
185
-
186
-
187
-
188
-
189
-
190
-
191
-
192
-
193
-
194
-
195
-
196
-
197
-
198
-
199
-
200
-
201
-
202
-
203
-
204
-
205
-
206
-
207
-
208
-
209
-
210
-
211
-
212
-
213
-
214
-
215
-
216
-
217
-
218
-
219
-
220
-
221
-
222
-
223
-
224
-
225
-
226
-
227
-
228
-
229
-
230
-
231
-
232
-
233
-
234
-
235
-
236
-
237
-
238
-
239
-
240
-
241
-
242
-
243
-
244
-
245
-
246
-
247
-
248
-
249
-
250
-
251
-
252
-
253
-
254
-
255
-
256
-
257
-
258
-
259
-
260
-
261
-
262
-
263
-
264
-
265
-
266
-
267
-
268
-
269
-
270
-
271
-
272
-
273
-
274
-
275
-
276
-
277
-
278
-
279
-
280
-
281
-
282
-
283
-
284
-
285
-
286
-
 287
287 -
 288
288 -
 289
289 -
 290
290 -
 291
291 -
 292
292 -
 293
293 -
 294
294 -
 295
295 -
 296
296 -
 297
297 -
 298
298 -
 299
299 -
 300
300 -
 301
301 -
 302
302 -
 303
303 -
 304
304 -
 305
305 -
 306
306 -
 307
307 -
308
-
309
-
310
-
311
-
312
-
313
-
314
-
315
-
316
-
317
-
318
-
319
-
320
-
321
-
322
-
323
-
324
-
325
-
326
-
327
-
328
-
329
-
330
-
331
-
332
-
333
-
334
-
335
-
336
-
337
-
338
-
339
-
340
-
341
-
342
-
343
-
344
-
345
-
346
-
347
-
348
-
349
-
350
-
351
-
352
-
353
-
354
-
355
-
356
-
357
-
358
-
359
-
360
-
361
-
362
-
363
-
364
-
365
-
366
-
367
-
368
-
369
-
370
-
371
-
372
-
373
-
374
-
375
-
376
-
377
-
378
-
379
-
380
-
381
-
382
-
383
-
384
-
385
-
386
-
387
-
388
-
389
-
390
-
391
-
392
-
393
-
394
-
395
-
396
 |
 |
295
Overview Operating & Financial Review Governance Financial Statements Shareholder Information
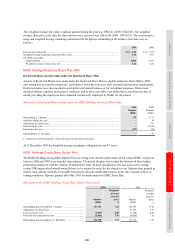
reduced the deferred tax assets by US$1.2bn. US legislation enacted on 6 November 2009 allowed for an extended
carryback period for certain federal tax net operating losses. This had the effect of crystallising deferred tax assets
related to such losses at 31 December 2009 by approximately US$1.6bn. Currently, it has been determined that the
US operations primary tax planning strategy, in combination with other tax planning strategies, provides support for
the realisation of the net deferred tax assets recorded for the US operations. Such determination is based on HSBC’s
business forecasts and assessments as to the most efficient and effective deployment of HSBC capital, most
importantly including the length of time such capital will need to be maintained in the US for purposes of the tax
planning strategy.
The deferred tax assets relating to HSBC’s Brazil operation is US$0.9bn (2009: US$1.3bn) and the Mexican
operation is US$0.7bn (2009: US$0.6bn). On the evidence available, including management projections of income
and the state of the Brazilian and Mexican economies, there will be sufficient taxable income generated by the
businesses to support these assets.
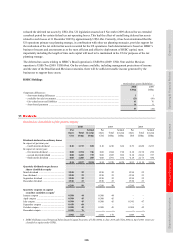
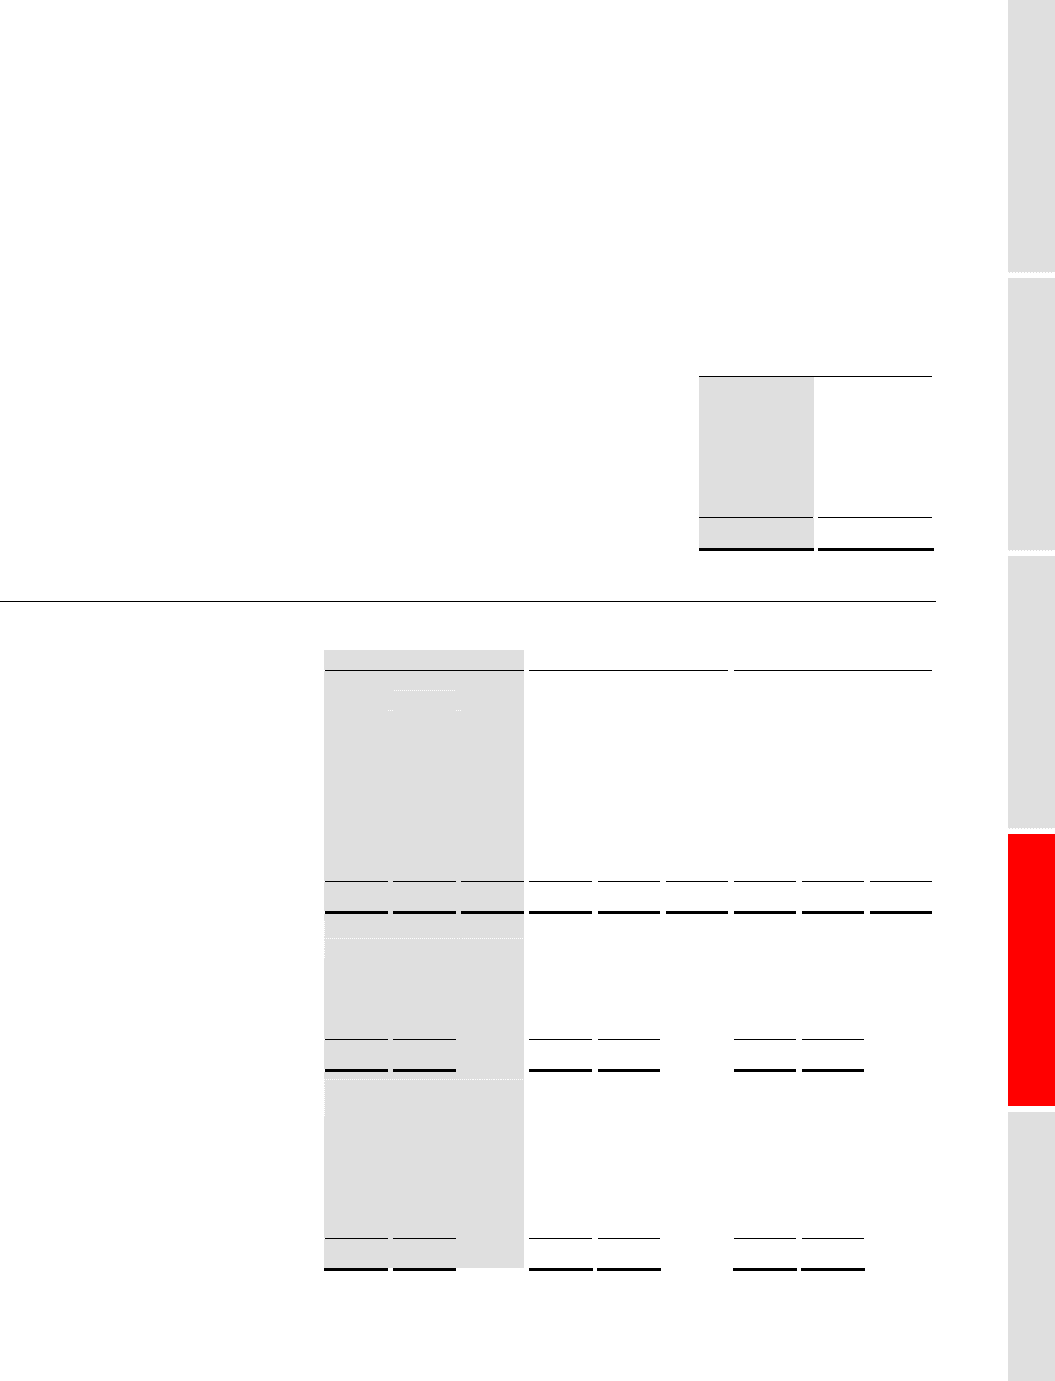
HSBC Holdings
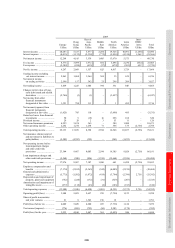
Deferred tax assets/(liabilities)
2010 2009
US$m US$m
Temporary differences:
– short-term timing differences ............................................................................................................ 1 1
– available-for-sale investments ........................................................................................................... (21) (99)
– fair valued assets and liabilities ........................................................................................................ 61 76
– share-based payments ........................................................................................................................ 16 8
57 (14)
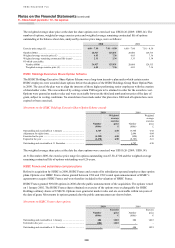
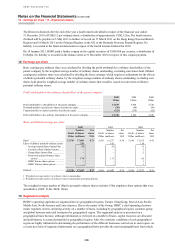
11 Dividends
Dividends to shareholders of the parent company
2010 2009 2008
Per
share
US$
Total
US$m
Settled
in scrip
US$m
Per
share
US$
Total
US$m
Settled
in scrip
US$m
Per
share
US$
Total
US$m
Settled
in scrip
US$m
Dividends declared on ordinary shares
In respect of previous year:
– fourth interim dividend ....................... 0.10 1,733 838 0.10 1,210 624 0.39 4,620 2,233
In respect of current year:
– first interim dividend ........................... 0.08 1,394 746 0.08 1,384 190 0.18 2,158 256
– second interim dividend ...................... 0.08 1,402 735 0.08 1,385 696 0.18 2,166 727
– third interim dividend .......................... 0.08 1,408 205 0.08 1,391 160 0.18 2,175 380
0.34 5,937 2,524 0.34 5,370 1,670 0.93 11,119 3,596
Quarterly dividends on preference
shares classified as equity
March dividend ........................................... 15.50 22 15.50 22 15.50 22
June dividend .............................................. 15.50 23 15.50 23 15.50 23
September dividend .................................... 15.50 22 15.50 22 15.50 22
December dividend ..................................... 15.50 23 15.50 23 15.50 23
62.00 90 62.00 90 62.00 90
Quarterly coupons on capital
securities classified as equity1
January coupon ........................................... 0.508 44 0.508 44 – –
April coupon ............................................... 0.508 45 0.508 45 – –
July coupon ................................................. 0.508 45 0.508 45 0.541 47
September coupon ...................................... 0.450 68 – – – –
October coupon ........................................... 0.508 45 0.508 45 0.508 45
December coupon ....................................... 0.500 76 – – – –
2.982 323 2.032 179 1.049 92
1 HSBC Holdings issued Perpetual Subordinated Capital Securities of US$3,800m in June 2010 and US$2,200m in April 2008, which are
classified as equity under IFRSs.