HSBC 2010 Annual Report Download - page 104
Download and view the complete annual report
Please find page 104 of the 2010 HSBC annual report below. You can navigate through the pages in the report by either clicking on the pages listed below, or by using the keyword search tool below to find specific information within the annual report.-
 1
1 -
2
-
3
-
4
-
5
-
6
-
7
-
8
-
9
-
10
-
11
-
12
-
13
-
14
-
15
-
16
-
17
-
18
-
19
-
20
-
21
-
22
-
23
-
24
-
25
-
26
-
27
-
28
-
29
-
30
-
31
-
32
-
33
-
34
-
35
-
36
-
37
-
38
-
39
-
40
-
41
-
42
-
43
-
44
-
45
-
46
-
47
-
48
-
49
-
50
-
51
-
52
-
53
-
54
-
55
-
56
-
57
-
58
-
59
-
60
-
61
-
62
-
63
-
64
-
65
-
66
-
67
-
68
-
69
-
70
-
71
-
72
-
73
-
74
-
75
-
76
-
77
-
78
-
79
-
80
-
81
-
82
-
83
-
84
-
85
-
86
-
87
-
88
-
89
-
90
-
91
-
92
-
93
-
 94
94 -
 95
95 -
 96
96 -
 97
97 -
 98
98 -
 99
99 -
 100
100 -
 101
101 -
 102
102 -
 103
103 -
 104
104 -
 105
105 -
 106
106 -
 107
107 -
 108
108 -
 109
109 -
 110
110 -
 111
111 -
 112
112 -
 113
113 -
 114
114 -
115
-
116
-
117
-
118
-
119
-
120
-
121
-
122
-
123
-
124
-
125
-
126
-
127
-
128
-
129
-
130
-
131
-
132
-
133
-
134
-
135
-
136
-
137
-
138
-
139
-
140
-
141
-
142
-
143
-
144
-
145
-
146
-
147
-
148
-
149
-
150
-
151
-
152
-
153
-
154
-
155
-
156
-
157
-
158
-
159
-
160
-
161
-
162
-
163
-
164
-
165
-
166
-
167
-
168
-
169
-
170
-
171
-
172
-
173
-
174
-
175
-
176
-
177
-
178
-
179
-
180
-
181
-
182
-
183
-
184
-
185
-
186
-
187
-
188
-
189
-
190
-
191
-
192
-
193
-
194
-
195
-
196
-
197
-
198
-
199
-
200
-
201
-
202
-
203
-
204
-
205
-
206
-
207
-
208
-
209
-
210
-
211
-
212
-
213
-
214
-
215
-
216
-
217
-
218
-
219
-
220
-
221
-
222
-
223
-
224
-
225
-
226
-
227
-
228
-
229
-
230
-
231
-
232
-
233
-
234
-
235
-
236
-
237
-
238
-
239
-
240
-
241
-
242
-
243
-
244
-
245
-
246
-
247
-
248
-
249
-
250
-
251
-
252
-
253
-
254
-
255
-
256
-
257
-
258
-
259
-
260
-
261
-
262
-
263
-
264
-
265
-
266
-
267
-
268
-
269
-
270
-
271
-
272
-
273
-
274
-
275
-
276
-
277
-
278
-
279
-
280
-
281
-
282
-
283
-
284
-
285
-
286
-
287
-
288
-
289
-
290
-
291
-
292
-
293
-
294
-
295
-
296
-
297
-
298
-
299
-
300
-
301
-
302
-
303
-
304
-
305
-
306
-
307
-
308
-
309
-
310
-
311
-
312
-
313
-
314
-
315
-
316
-
317
-
318
-
319
-
320
-
321
-
322
-
323
-
324
-
325
-
326
-
327
-
328
-
329
-
330
-
331
-
332
-
333
-
334
-
335
-
336
-
337
-
338
-
339
-
340
-
341
-
342
-
343
-
344
-
345
-
346
-
347
-
348
-
349
-
350
-
351
-
352
-
353
-
354
-
355
-
356
-
357
-
358
-
359
-
360
-
361
-
362
-
363
-
364
-
365
-
366
-
367
-
368
-
369
-
370
-
371
-
372
-
373
-
374
-
375
-
376
-
377
-
378
-
379
-
380
-
381
-
382
-
383
-
384
-
385
-
386
-
387
-
388
-
389
-
390
-
391
-
392
-
393
-
394
-
395
-
396
 |
 |

HSBC HOLDINGS PLC
Report of the Directors: Operating and Financial Review (continued)
Risk > Credit risk > Credit exposure / Areas of special interest > Wholesale lending
102
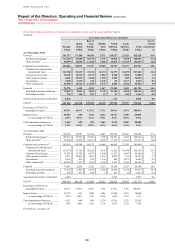
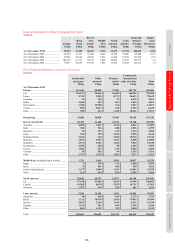
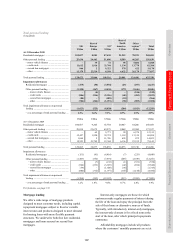
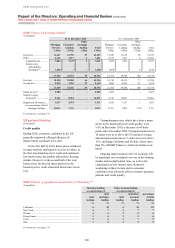
Gross loans and advances to customers by country (continued)
Residential
mortgages
US$m
Other
personal
US$m
Property-
related
US$m
Commercial,
international
trade and other
US$m
Total
US$m
At 31 December 2009
Europe ............................................................. 109,872 52,690 40,084 242,970 445,616
UK ................................................................... 100,667 29,018 28,339 175,513 333,537
France ............................................................. 4,326 10,224 9,429 48,570 72,549
Germany ......................................................... 10 404 90 3,689 4,193
Malta ............................................................... 1,730 612 660 1,689 4,691
Switzerland ..................................................... 1,301 9,197 175 1,413 12,086
Turkey ............................................................. 843 2,778 150 2,490 6,261
Other ............................................................... 995 457 1,241 9,606 12,299
Hong Kong ..................................................... 35,292 12,654 23,844 28,395 100,185
Rest of Asia-Pacific ........................................ 21,983 10,531 10,338 38,187 81,039
Australia .......................................................... 5,919 993 1,785 3,496 12,193
India ................................................................ 883 864 458 3,002 5,207
Indonesia ......................................................... 59 571 71 2,114 2,815
Japan ............................................................... 109 149 796 1,444 2,498
Mainland China .............................................. 1,503 319 2,633 8,915 13,370
Malaysia .......................................................... 2,925 1,717 1,085 3,548 9,275
Singapore ........................................................ 5,149 3,041 2,407 4,251 14,848
South Korea .................................................... 2,093 407 30 1,932 4,462
Taiwan ............................................................ 2,205 503 53 1,578 4,339
Vietnam ........................................................... 23 132 51 1,042 1,248
Other ............................................................... 1,115 1,835 969 6,865 10,784
Middle East (excluding Saudi Arabia) ........... 1,898 4,507 2,666 15,151 24,222
Egypt ............................................................... 4 326 126 2,132 2,588
Qatar ............................................................... 9 624 416 841 1,890
United Arab Emirates ..................................... 1,650 2,881 1,395 8,848 14,774
Other ............................................................... 235 676 729 3,330 4,970
North America ................................................ 86,591 77,343 19,979 36,616 220,529
US ................................................................... 65,784 69,275 8,922 25,747 169,728
Canada ............................................................ 19,228 7,526 10,641 10,339 47,734
Bermuda .......................................................... 1,579 542 416 530 3,067
Latin America ................................................. 5,033 15,812 2,998 26,339 50,182
Argentina ........................................................ 31 628 49 1,689 2,397
Brazil ............................................................... 717 10,494 1,076 12,111 24,398
Mexico ............................................................ 2,259 2,702 995 6,762 12,718
Panama ............................................................ 1,151 973 475 3,464 6,063
Other ............................................................... 875 1,015 403 2,313 4,606
Total ................................................................ 260,669 173,537 99,909 387,658 921,773
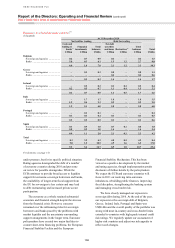
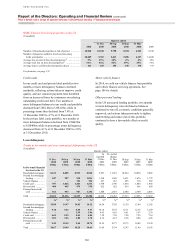
Country distribution of outstandings and
cross-border exposures
(Unaudited)
We control the risk associated with cross-border
lending through a centralised structure of internal
country limits. Exposures to individual countries and
cross-border exposure in the aggregate are kept
under continual review.
The following table summarises the aggregate
of in-country foreign currency and cross-border
outstandings by type of borrower to countries which
individually represent in excess of 0.75% of our total
assets. The classification is based on the country of
residence of the borrower but also recognises the
transfer of country risk in respect of third-party
guarantees, eligible collateral held and residence of
the head office when the borrower is a branch. In
accordance with the Bank of England Country
Exposure Report (Form CE) guidelines, outstandings
comprise loans and advances (excluding settlement
accounts), amounts receivable under finance leases,
acceptances, commercial bills, certificates of deposit
(‘CD’s) and debt and equity securities (net of short
positions), and exclude accrued interest and
intra-HSBC exposures.