HSBC 2010 Annual Report Download - page 34
Download and view the complete annual report
Please find page 34 of the 2010 HSBC annual report below. You can navigate through the pages in the report by either clicking on the pages listed below, or by using the keyword search tool below to find specific information within the annual report.-
 1
1 -
2
-
3
-
4
-
5
-
6
-
7
-
8
-
9
-
10
-
11
-
12
-
13
-
14
-
15
-
16
-
17
-
18
-
19
-
20
-
21
-
22
-
23
-
 24
24 -
 25
25 -
 26
26 -
 27
27 -
 28
28 -
 29
29 -
 30
30 -
 31
31 -
 32
32 -
 33
33 -
 34
34 -
 35
35 -
 36
36 -
 37
37 -
 38
38 -
 39
39 -
 40
40 -
 41
41 -
 42
42 -
 43
43 -
 44
44 -
45
-
46
-
47
-
48
-
49
-
50
-
51
-
52
-
53
-
54
-
55
-
56
-
57
-
58
-
59
-
60
-
61
-
62
-
63
-
64
-
65
-
66
-
67
-
68
-
69
-
70
-
71
-
72
-
73
-
74
-
75
-
76
-
77
-
78
-
79
-
80
-
81
-
82
-
83
-
84
-
85
-
86
-
87
-
88
-
89
-
90
-
91
-
92
-
93
-
94
-
95
-
96
-
97
-
98
-
99
-
100
-
101
-
102
-
103
-
104
-
105
-
106
-
107
-
108
-
109
-
110
-
111
-
112
-
113
-
114
-
115
-
116
-
117
-
118
-
119
-
120
-
121
-
122
-
123
-
124
-
125
-
126
-
127
-
128
-
129
-
130
-
131
-
132
-
133
-
134
-
135
-
136
-
137
-
138
-
139
-
140
-
141
-
142
-
143
-
144
-
145
-
146
-
147
-
148
-
149
-
150
-
151
-
152
-
153
-
154
-
155
-
156
-
157
-
158
-
159
-
160
-
161
-
162
-
163
-
164
-
165
-
166
-
167
-
168
-
169
-
170
-
171
-
172
-
173
-
174
-
175
-
176
-
177
-
178
-
179
-
180
-
181
-
182
-
183
-
184
-
185
-
186
-
187
-
188
-
189
-
190
-
191
-
192
-
193
-
194
-
195
-
196
-
197
-
198
-
199
-
200
-
201
-
202
-
203
-
204
-
205
-
206
-
207
-
208
-
209
-
210
-
211
-
212
-
213
-
214
-
215
-
216
-
217
-
218
-
219
-
220
-
221
-
222
-
223
-
224
-
225
-
226
-
227
-
228
-
229
-
230
-
231
-
232
-
233
-
234
-
235
-
236
-
237
-
238
-
239
-
240
-
241
-
242
-
243
-
244
-
245
-
246
-
247
-
248
-
249
-
250
-
251
-
252
-
253
-
254
-
255
-
256
-
257
-
258
-
259
-
260
-
261
-
262
-
263
-
264
-
265
-
266
-
267
-
268
-
269
-
270
-
271
-
272
-
273
-
274
-
275
-
276
-
277
-
278
-
279
-
280
-
281
-
282
-
283
-
284
-
285
-
286
-
287
-
288
-
289
-
290
-
291
-
292
-
293
-
294
-
295
-
296
-
297
-
298
-
299
-
300
-
301
-
302
-
303
-
304
-
305
-
306
-
307
-
308
-
309
-
310
-
311
-
312
-
313
-
314
-
315
-
316
-
317
-
318
-
319
-
320
-
321
-
322
-
323
-
324
-
325
-
326
-
327
-
328
-
329
-
330
-
331
-
332
-
333
-
334
-
335
-
336
-
337
-
338
-
339
-
340
-
341
-
342
-
343
-
344
-
345
-
346
-
347
-
348
-
349
-
350
-
351
-
352
-
353
-
354
-
355
-
356
-
357
-
358
-
359
-
360
-
361
-
362
-
363
-
364
-
365
-
366
-
367
-
368
-
369
-
370
-
371
-
372
-
373
-
374
-
375
-
376
-
377
-
378
-
379
-
380
-
381
-
382
-
383
-
384
-
385
-
386
-
387
-
388
-
389
-
390
-
391
-
392
-
393
-
394
-
395
-
396
 |
 |
HSBC HOLDINGS PLC
Report of the Directors: Operating and Financial Review (continued)
Financial summary > Economic profit / Critical accounting policies
32
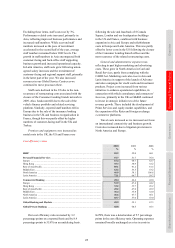
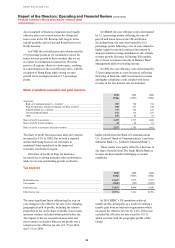
Economic profit
Our internal performance measures include
economic profit/(loss), a calculation which compares
the return on financial capital invested in HSBC by
our shareholders with the cost of that capital. We
price our cost of capital internally and the difference
between that cost and the post-tax profit attributable
to ordinary shareholders represents the amount of
economic profit/(loss) generated. Economic
profit/(loss) generated is used by management as
one input in deciding where to allocate capital and
other resources.
In order to concentrate on external factors rather
than measurement bases, we emphasise the trend in
economic profit/(loss) ahead of absolute amounts
within business units. Our long-term cost of capital
is reviewed annually and for 2010 it was revised to
11% from the 10% used in 2009. We use a Capital
Asset Pricing Model to determine our cost of capital.
The main drivers of the increase were an increase in
the risk free rate and an increase in the betas used in
the calculation. The following commentary is on a
reported basis.
Our economic loss decreased by US$4.7bn to
US$3.3bn as a result of an increase in profit
attributable to shareholders. This was predominantly
driven by lower loan impairment charges across all
regions and customer groups, notably in the US due
to lower balances and decreased delinquency rates
in Card and Retail Services, and the run-off of the
Consumer Lending and mortgage services portfolio.
The increase in average invested capital
reflected higher retained earnings and a significant
decrease in reserves representing unrealised losses
on available-for-sale securities due to a slowing in
the rate of anticipated losses in the underlying
collateral pools.
The return on invested capital increased by
4.6 percentage points, although it remained below our
benchmark cost of capital. The economic spread
improved by 3.6 percentage points, the result of an
increase in return on invested capital, partly offset by
the rise in the cost of capital in 2010.
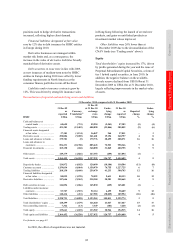
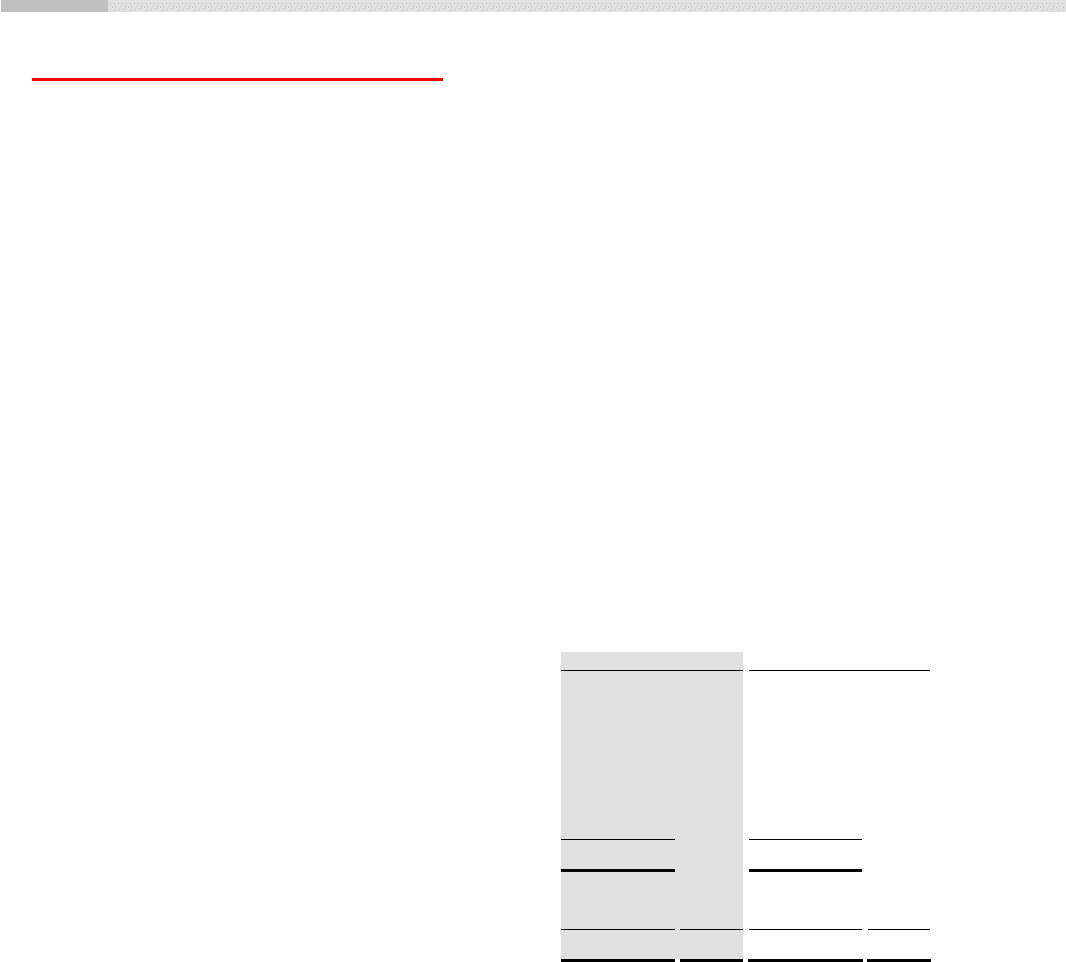
2010 2009
US$m %
41 US$m %40
Average total shareholders’ equity ......................................................................... 138,224 115,431
Adjusted by:
Goodwill previously amortised or written off ................................................... 8,123 8,123
Property revaluation reserves ............................................................................. (813) (799)
Reserves representing unrealised losses on effective cash flow hedges ........... 100 385
Reserves representing unrealised losses on available-for-sale securities .......... 6,129 16,189
Preference shares and other equity instruments ................................................. (5,473) (3,538)
Average invested capital42 ...................................................................................... 146,290 135,791
Return on invested capital43 .................................................................................... 12,746 8.7 5,565 4.1
Benchmark cost of capital ...................................................................................... (16,092) (11.0) (13,579) (10.0)
Economic loss and spread ...................................................................................... (3,346) (2.3) (8,014) (5.9)
For footnotes, see page 83.