HSBC 2010 Annual Report Download - page 115
Download and view the complete annual report
Please find page 115 of the 2010 HSBC annual report below. You can navigate through the pages in the report by either clicking on the pages listed below, or by using the keyword search tool below to find specific information within the annual report.-
 1
1 -
2
-
3
-
4
-
5
-
6
-
7
-
8
-
9
-
10
-
11
-
12
-
13
-
14
-
15
-
16
-
17
-
18
-
19
-
20
-
21
-
22
-
23
-
24
-
25
-
26
-
27
-
28
-
29
-
30
-
31
-
32
-
33
-
34
-
35
-
36
-
37
-
38
-
39
-
40
-
41
-
42
-
43
-
44
-
45
-
46
-
47
-
48
-
49
-
50
-
51
-
52
-
53
-
54
-
55
-
56
-
57
-
58
-
59
-
60
-
61
-
62
-
63
-
64
-
65
-
66
-
67
-
68
-
69
-
70
-
71
-
72
-
73
-
74
-
75
-
76
-
77
-
78
-
79
-
80
-
81
-
82
-
83
-
84
-
85
-
86
-
87
-
88
-
89
-
90
-
91
-
92
-
93
-
94
-
95
-
96
-
97
-
98
-
99
-
100
-
101
-
102
-
103
-
104
-
 105
105 -
 106
106 -
 107
107 -
 108
108 -
 109
109 -
 110
110 -
 111
111 -
 112
112 -
 113
113 -
 114
114 -
 115
115 -
 116
116 -
 117
117 -
 118
118 -
 119
119 -
 120
120 -
 121
121 -
 122
122 -
 123
123 -
 124
124 -
 125
125 -
126
-
127
-
128
-
129
-
130
-
131
-
132
-
133
-
134
-
135
-
136
-
137
-
138
-
139
-
140
-
141
-
142
-
143
-
144
-
145
-
146
-
147
-
148
-
149
-
150
-
151
-
152
-
153
-
154
-
155
-
156
-
157
-
158
-
159
-
160
-
161
-
162
-
163
-
164
-
165
-
166
-
167
-
168
-
169
-
170
-
171
-
172
-
173
-
174
-
175
-
176
-
177
-
178
-
179
-
180
-
181
-
182
-
183
-
184
-
185
-
186
-
187
-
188
-
189
-
190
-
191
-
192
-
193
-
194
-
195
-
196
-
197
-
198
-
199
-
200
-
201
-
202
-
203
-
204
-
205
-
206
-
207
-
208
-
209
-
210
-
211
-
212
-
213
-
214
-
215
-
216
-
217
-
218
-
219
-
220
-
221
-
222
-
223
-
224
-
225
-
226
-
227
-
228
-
229
-
230
-
231
-
232
-
233
-
234
-
235
-
236
-
237
-
238
-
239
-
240
-
241
-
242
-
243
-
244
-
245
-
246
-
247
-
248
-
249
-
250
-
251
-
252
-
253
-
254
-
255
-
256
-
257
-
258
-
259
-
260
-
261
-
262
-
263
-
264
-
265
-
266
-
267
-
268
-
269
-
270
-
271
-
272
-
273
-
274
-
275
-
276
-
277
-
278
-
279
-
280
-
281
-
282
-
283
-
284
-
285
-
286
-
287
-
288
-
289
-
290
-
291
-
292
-
293
-
294
-
295
-
296
-
297
-
298
-
299
-
300
-
301
-
302
-
303
-
304
-
305
-
306
-
307
-
308
-
309
-
310
-
311
-
312
-
313
-
314
-
315
-
316
-
317
-
318
-
319
-
320
-
321
-
322
-
323
-
324
-
325
-
326
-
327
-
328
-
329
-
330
-
331
-
332
-
333
-
334
-
335
-
336
-
337
-
338
-
339
-
340
-
341
-
342
-
343
-
344
-
345
-
346
-
347
-
348
-
349
-
350
-
351
-
352
-
353
-
354
-
355
-
356
-
357
-
358
-
359
-
360
-
361
-
362
-
363
-
364
-
365
-
366
-
367
-
368
-
369
-
370
-
371
-
372
-
373
-
374
-
375
-
376
-
377
-
378
-
379
-
380
-
381
-
382
-
383
-
384
-
385
-
386
-
387
-
388
-
389
-
390
-
391
-
392
-
393
-
394
-
395
-
396
 |
 |

113
Overview Operating & Financial Review Governance Financial Statements Shareholder Information
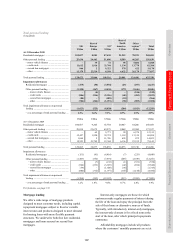
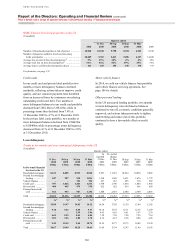
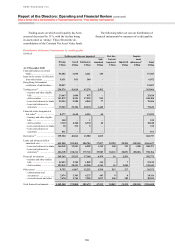
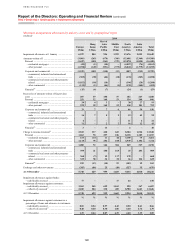
Quarter ended
31 Dec
2010
30 Sep
2010
30 Jun
2010
31 Mar
2010
As
reported
31 Dec
2009
Ex. period
change
31 Dec
2009
30 Sep
2009
30 Jun
2009
31 Mar
2009
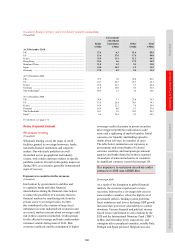
US$m US$m US$m US$m US$m US$m US$m US$m US$m Mortgage Services
and Consumer
Lending24
Mortgage Services: .... 3,002 3,117 3,067 3,236 3,477 4,456 4,250 4,257 4,535
– first lien ............... 2,757 2,850 2,788 2,928 3,093 3,900 3,688 3,642 3,824
– second lien .......... 245 267 279 308 384 556 562 615 711
Consumer Lending: ... 5,284 5,495 5,278 5,493 6,022 7,445 7,131 6,514 6,203
– first lien ............... 4,861 5,022 4,795 4,970 5,380 6,541 6,241 5,640 5,322
– second lien .......... 423 473 483 523 642 904 890 874 881
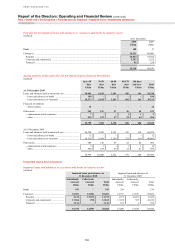
%23 %23 %23 %23 %
23 %
23 %
23 %23 %23
Mortgage Services:
– first lien ............... 18.02 17.73 16.50 16.38 16.53 20.00 18.09 17.13 17.24
– second lien .......... 10.80 10.93 10.63 10.87 12.57 17.25 16.36 16.35 17.44
– total ..................... 17.09 16.83 15.71 15.62 15.98 19.61 17.84 17.01 17.27
Consumer Lending:
– first lien ............... 16.23 16.16 14.85 14.79 15.41 18.15 16.75 14.72 13.52
– second lien .......... 12.72 13.16 12.44 12.25 13.98 18.64 17.49 16.17 15.43
– total ..................... 15.88 15.85 14.59 14.51 15.24 18.21 16.84 14.90 13.76
For footnotes, see page 174.
Forbearance strategies and renegotiated
loans
(Audited)
A range of forbearance strategies are employed in
order to improve the management of customer
relationships, maximise collection opportunities and,
if possible, avoid foreclosure or repossession. Our
policies and practices are based on criteria which, in
the judgement of local management, indicate that
repayment is likely to continue.
Forbearance arrangements include extended
payment terms, a reduction in interest or principal
repayments, approved external debt management
plans, the deferral of foreclosures, other
modifications, and loan restructures. These
management policies and practices typically provide
the customer with terms and conditions that are more
favourable than those provided initially. Such
arrangements could include cases where an account
is brought up-to-date without full repayment of all
the arrears.
Our most common forbearance arrangements
are loan restructures applied to real estate loans
within consumer finance portfolios in the US. Our
credit risk management policy sets out restrictions
on the number and frequency of restructures, the
minimum period an account must have been opened
before any restructure can be considered, and the
number of qualifying payments that must be
received before an account may be considered
restructured and up-to-date. The application of this
policy varies according to the nature of the market,
the product and the management of customer
relationships through the occurrence of exceptional
events.
Loans that are subject to restructuring may only
be classified as restructured and up-to-date once a
specified number and/or amount of qualifying
payments have been received. These qualifying
payments are set at a level appropriate to the nature
of the loan and the customer’s ability to make the
repayment going forward. Typically the receipt of
two or more qualifying payments is required within
a certain period, generally 60 days (in the case of
HSBC Finance, in certain circumstances, for
example where debt has been restructured in
bankruptcy proceedings, fewer or no payments may
be required). Loans that have been restructured and
would otherwise have been past due or impaired are
classified as renegotiated.
Renegotiated loans are segregated from other
parts of the loan portfolio for collective impairment
assessment, to reflect the higher rates of losses often
encountered in this segment of the portfolio. When
empirical evidence indicates an increased propensity
to default and higher losses on such accounts, the use
of roll rate methodology ensures these factors are
taken into account when calculating impairment
allowances. The carrying amount of loans that
have been classified as renegotiated retain this
classification until maturity or derecognition. Interest
is recorded on renegotiated loans on the basis of new
contractual terms following renegotiation.