HSBC 2010 Annual Report Download - page 66
Download and view the complete annual report
Please find page 66 of the 2010 HSBC annual report below. You can navigate through the pages in the report by either clicking on the pages listed below, or by using the keyword search tool below to find specific information within the annual report.-
 1
1 -
2
-
3
-
4
-
5
-
6
-
7
-
8
-
9
-
10
-
11
-
12
-
13
-
14
-
15
-
16
-
17
-
18
-
19
-
20
-
21
-
22
-
23
-
24
-
25
-
26
-
27
-
28
-
29
-
30
-
31
-
32
-
33
-
34
-
35
-
36
-
37
-
38
-
39
-
40
-
41
-
42
-
43
-
44
-
45
-
46
-
47
-
48
-
49
-
50
-
51
-
52
-
53
-
54
-
55
-
 56
56 -
 57
57 -
 58
58 -
 59
59 -
 60
60 -
 61
61 -
 62
62 -
 63
63 -
 64
64 -
 65
65 -
 66
66 -
 67
67 -
 68
68 -
 69
69 -
 70
70 -
 71
71 -
 72
72 -
 73
73 -
 74
74 -
 75
75 -
 76
76 -
77
-
78
-
79
-
80
-
81
-
82
-
83
-
84
-
85
-
86
-
87
-
88
-
89
-
90
-
91
-
92
-
93
-
94
-
95
-
96
-
97
-
98
-
99
-
100
-
101
-
102
-
103
-
104
-
105
-
106
-
107
-
108
-
109
-
110
-
111
-
112
-
113
-
114
-
115
-
116
-
117
-
118
-
119
-
120
-
121
-
122
-
123
-
124
-
125
-
126
-
127
-
128
-
129
-
130
-
131
-
132
-
133
-
134
-
135
-
136
-
137
-
138
-
139
-
140
-
141
-
142
-
143
-
144
-
145
-
146
-
147
-
148
-
149
-
150
-
151
-
152
-
153
-
154
-
155
-
156
-
157
-
158
-
159
-
160
-
161
-
162
-
163
-
164
-
165
-
166
-
167
-
168
-
169
-
170
-
171
-
172
-
173
-
174
-
175
-
176
-
177
-
178
-
179
-
180
-
181
-
182
-
183
-
184
-
185
-
186
-
187
-
188
-
189
-
190
-
191
-
192
-
193
-
194
-
195
-
196
-
197
-
198
-
199
-
200
-
201
-
202
-
203
-
204
-
205
-
206
-
207
-
208
-
209
-
210
-
211
-
212
-
213
-
214
-
215
-
216
-
217
-
218
-
219
-
220
-
221
-
222
-
223
-
224
-
225
-
226
-
227
-
228
-
229
-
230
-
231
-
232
-
233
-
234
-
235
-
236
-
237
-
238
-
239
-
240
-
241
-
242
-
243
-
244
-
245
-
246
-
247
-
248
-
249
-
250
-
251
-
252
-
253
-
254
-
255
-
256
-
257
-
258
-
259
-
260
-
261
-
262
-
263
-
264
-
265
-
266
-
267
-
268
-
269
-
270
-
271
-
272
-
273
-
274
-
275
-
276
-
277
-
278
-
279
-
280
-
281
-
282
-
283
-
284
-
285
-
286
-
287
-
288
-
289
-
290
-
291
-
292
-
293
-
294
-
295
-
296
-
297
-
298
-
299
-
300
-
301
-
302
-
303
-
304
-
305
-
306
-
307
-
308
-
309
-
310
-
311
-
312
-
313
-
314
-
315
-
316
-
317
-
318
-
319
-
320
-
321
-
322
-
323
-
324
-
325
-
326
-
327
-
328
-
329
-
330
-
331
-
332
-
333
-
334
-
335
-
336
-
337
-
338
-
339
-
340
-
341
-
342
-
343
-
344
-
345
-
346
-
347
-
348
-
349
-
350
-
351
-
352
-
353
-
354
-
355
-
356
-
357
-
358
-
359
-
360
-
361
-
362
-
363
-
364
-
365
-
366
-
367
-
368
-
369
-
370
-
371
-
372
-
373
-
374
-
375
-
376
-
377
-
378
-
379
-
380
-
381
-
382
-
383
-
384
-
385
-
386
-
387
-
388
-
389
-
390
-
391
-
392
-
393
-
394
-
395
-
396
 |
 |

HSBC HOLDINGS PLC
Report of the Directors: Operating and Financial Review (continued)
Geographical regions > Rest of Asia-Pacific
64
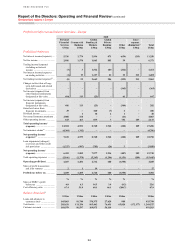
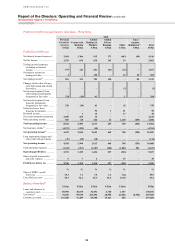
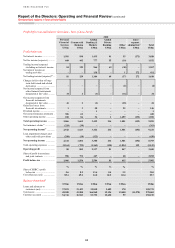
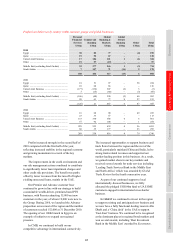
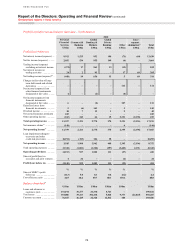
Profit before tax and balance sheet data – Rest of Asia-Pacific
2010
Personal
Financial
Services
US$m
Commercial
Banking
US$m
Global
Banking &
Markets
US$m
Global
Private
Banking
US$m
Other
US$m
Inter-
segment
elimination56
US$m
Total
US$m
Profit before tax
Net interest income ..................... 1,581 938 1,435 91 55 (272) 3,828
Net fee income/(expense) ........... 668 442 777 55 (10) – 1,932
Trading income/(expense)
excluding net interest income 81 129 966 69 (38) – 1,207
Net interest income on
trading activities ..................... – – 138 –1 272 411
Net trading income/(expense)49 .. 81 129 1,104 69 (37) 272 1,618
Changes in fair value of long-
term debt issued and related
derivatives .............................. – – – – (2) – (2)
Net income/(expense) from
other financial instruments
designated at fair value ........... 41 2 (1) –(16) – 26
Net income/(expense) from
financial instruments
designated at fair value ........... 41 2 (1) – (18) – 24
Gains less losses from
financial investments .............. 1 3 50 – 92 – 146
Dividend income ......................... – – 1 – – – 1
Net earned insurance premiums . 386 62 – – – – 448
Other operating income .............. 108 86 56 1 1,499 (152) 1,598
Total operating income ............ 2,866 1,662 3,422 216 1,581 (152) 9,595
Net insurance claims57 ................ (324) (39) – – – – (363)
Net operating income46 ............. 2,542 1,623 3,422 216 1,581 (152) 9,232
Loan impairment charges and
other credit risk provisions ..... (298) (19) (122) – – – (439)
Net operating income ............... 2,244 1,604 3,300 216 1,581 (152) 8,793
Total operating expenses ............ (2,164) (799) (1,163) (135) (1,034) 152 (5,143)
Operating profit ........................ 80 805 2,137 81 547 – 3,650
Share of profit in associates
and joint ventures ................... 986 751 447 – 68 – 2,252
Profit before tax ........................ 1,066 1,556 2,584 81 615 – 5,902
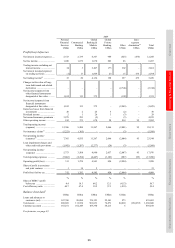
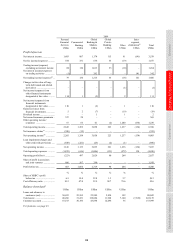
% % % %
%
%
Share of HSBC’s profit
before tax ................................ 5.6 8.2 13.6 0.4 3.2 31.0
Cost efficiency ratio ................... 85.1 49.2 34.0 62.5 65.4 55.7
Balance sheet data45
US$m US$m US$m US$m US$m US$m
Loans and advances to
customers (net) ....................... 37,831 31,423 35,810 3,489 178 108,731
Total assets ................................. 49,508 41,588 166,960 12,126 19,450 (11,570) 278,062
Customer accounts ...................... 54,741 36,943 53,752 12,620 99 158,155