HSBC 2010 Annual Report Download - page 79
Download and view the complete annual report
Please find page 79 of the 2010 HSBC annual report below. You can navigate through the pages in the report by either clicking on the pages listed below, or by using the keyword search tool below to find specific information within the annual report.-
 1
1 -
2
-
3
-
4
-
5
-
6
-
7
-
8
-
9
-
10
-
11
-
12
-
13
-
14
-
15
-
16
-
17
-
18
-
19
-
20
-
21
-
22
-
23
-
24
-
25
-
26
-
27
-
28
-
29
-
30
-
31
-
32
-
33
-
34
-
35
-
36
-
37
-
38
-
39
-
40
-
41
-
42
-
43
-
44
-
45
-
46
-
47
-
48
-
49
-
50
-
51
-
52
-
53
-
54
-
55
-
56
-
57
-
58
-
59
-
60
-
61
-
62
-
63
-
64
-
65
-
66
-
67
-
68
-
 69
69 -
 70
70 -
 71
71 -
 72
72 -
 73
73 -
 74
74 -
 75
75 -
 76
76 -
 77
77 -
 78
78 -
 79
79 -
 80
80 -
 81
81 -
 82
82 -
 83
83 -
 84
84 -
 85
85 -
 86
86 -
 87
87 -
 88
88 -
 89
89 -
90
-
91
-
92
-
93
-
94
-
95
-
96
-
97
-
98
-
99
-
100
-
101
-
102
-
103
-
104
-
105
-
106
-
107
-
108
-
109
-
110
-
111
-
112
-
113
-
114
-
115
-
116
-
117
-
118
-
119
-
120
-
121
-
122
-
123
-
124
-
125
-
126
-
127
-
128
-
129
-
130
-
131
-
132
-
133
-
134
-
135
-
136
-
137
-
138
-
139
-
140
-
141
-
142
-
143
-
144
-
145
-
146
-
147
-
148
-
149
-
150
-
151
-
152
-
153
-
154
-
155
-
156
-
157
-
158
-
159
-
160
-
161
-
162
-
163
-
164
-
165
-
166
-
167
-
168
-
169
-
170
-
171
-
172
-
173
-
174
-
175
-
176
-
177
-
178
-
179
-
180
-
181
-
182
-
183
-
184
-
185
-
186
-
187
-
188
-
189
-
190
-
191
-
192
-
193
-
194
-
195
-
196
-
197
-
198
-
199
-
200
-
201
-
202
-
203
-
204
-
205
-
206
-
207
-
208
-
209
-
210
-
211
-
212
-
213
-
214
-
215
-
216
-
217
-
218
-
219
-
220
-
221
-
222
-
223
-
224
-
225
-
226
-
227
-
228
-
229
-
230
-
231
-
232
-
233
-
234
-
235
-
236
-
237
-
238
-
239
-
240
-
241
-
242
-
243
-
244
-
245
-
246
-
247
-
248
-
249
-
250
-
251
-
252
-
253
-
254
-
255
-
256
-
257
-
258
-
259
-
260
-
261
-
262
-
263
-
264
-
265
-
266
-
267
-
268
-
269
-
270
-
271
-
272
-
273
-
274
-
275
-
276
-
277
-
278
-
279
-
280
-
281
-
282
-
283
-
284
-
285
-
286
-
287
-
288
-
289
-
290
-
291
-
292
-
293
-
294
-
295
-
296
-
297
-
298
-
299
-
300
-
301
-
302
-
303
-
304
-
305
-
306
-
307
-
308
-
309
-
310
-
311
-
312
-
313
-
314
-
315
-
316
-
317
-
318
-
319
-
320
-
321
-
322
-
323
-
324
-
325
-
326
-
327
-
328
-
329
-
330
-
331
-
332
-
333
-
334
-
335
-
336
-
337
-
338
-
339
-
340
-
341
-
342
-
343
-
344
-
345
-
346
-
347
-
348
-
349
-
350
-
351
-
352
-
353
-
354
-
355
-
356
-
357
-
358
-
359
-
360
-
361
-
362
-
363
-
364
-
365
-
366
-
367
-
368
-
369
-
370
-
371
-
372
-
373
-
374
-
375
-
376
-
377
-
378
-
379
-
380
-
381
-
382
-
383
-
384
-
385
-
386
-
387
-
388
-
389
-
390
-
391
-
392
-
393
-
394
-
395
-
396
 |
 |

77
Overview Operating & Financial Review Governance Financial Statements Shareholder Information
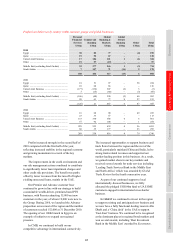
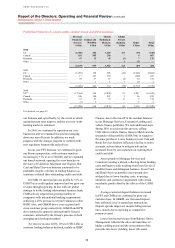
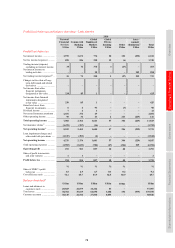
Profit/(loss) before tax by country within customer groups and global businesses
Personal
Financial
Services
US$m
Commercial
Banking
US$m
Global
Banking &
Markets
US$m
Global
Private
Banking
US$m
Other
US$m
Total
US$m
2010
Argentina .......................................................... 88 90 106 – – 284
Brazil ................................................................. 93 382 488 6 64 1,033
Mexico .............................................................. 165 24 219 4 (11) 401
Panama .............................................................. 48 57 33 2 – 140
Other ................................................................. (100) 1 51 (2) (13) (63)
294 554 897 10 40 1,795
2009
Argentina .......................................................... 24 86 122 – – 232
Brazil ................................................................. (224) 211 515 5 3 510
Mexico .............................................................. (31) 66 230 7 – 272
Panama .............................................................. 69 55 24 – – 148
Other ................................................................. (54) (19) 40 (1) (4) (38)
(216) 399 931 11 (1) 1,124
2008
Argentina .......................................................... – 111 113 – – 224
Brazil ................................................................. 250 348 298 8 6 910
Mexico .............................................................. 360 157 190 7 – 714
Panama .............................................................. 51 37 33 – – 121
Other ................................................................. 7 53 7 1 – 68
668 706 641 16 6 2,037
due to reduced transaction volumes, although this
was largely offset by increased income from Balance
Sheet Management.
In PFS, spreads tightened in Mexico as lending
was refocused from higher-yielding consumer loans
to higher quality assets. The managing down of
certain portfolios in Brazil and Mexico and the
strengthening of underwriting and collections
processes resulted in an overall increase in pre-tax
profit in PFS. Across the region we continued to
focus on new customer acquisition in the mass
affluent market segment through our Premier and
Advance propositions. The number of Premier
customers increased to over 790,000 at 31 December
2010. Advance was launched in Brazil, Mexico,
Argentina, Panama and Chile in 2010 and customer
numbers exceeded 425,000 at the end of the year.
The insurance business continued to perform
strongly, with revenue growing in Brazil, Mexico
and Argentina due to the improving economic
conditions.
The regional economic recovery and our focus
on growing the CMB business drove increased
domestic lending in our major markets. GB&M and
CMB both benefited from our global connectivity by
increasing intra-regional and inter-regional business,
with GB&M in particular contributing to other
regions and customer groups through increased
cross-referrals. Our operations in Brazil and
mainland China worked closely together on a
number of initiatives, including the completion of
the first renminbi-denominated trade settlement in
the region. Dedicated sales desks were established in
mainland China and Hong Kong to support our Latin
America customers and promote trade with Brazil.
Net interest income increased by 4% to
US$6.3bn. Increased volumes of financial
investments, a decline in the cost of funding trading
positions as market interest rates fell and a change
in the portfolio mix to higher-yielding longer-term
assets drove a rise in revenue from Balance Sheet
Management.
Average customer lending balances fell in PFS,
as certain portfolios were managed down, notably in
credit cards in Mexico and other higher-risk personal
loan balances in Mexico and Brazil. However,
year-end balances were higher than in 2009 as we
reversed the decline in customer lending by
selectively growing certain portfolios. Demand-
driven lending increased in CMB and GB&M in
Brazil and Argentina while, in Mexico, increased
average lending balances in CMB were attributable
to the continued strategy of targeting state and
municipal customers.
Our operations in Brazil actively grew customer
account balances to fund loan growth and meet
higher liquidity requirements following regulatory