HSBC 2010 Annual Report Download - page 22
Download and view the complete annual report
Please find page 22 of the 2010 HSBC annual report below. You can navigate through the pages in the report by either clicking on the pages listed below, or by using the keyword search tool below to find specific information within the annual report.-
 1
1 -
2
-
3
-
4
-
5
-
6
-
7
-
8
-
9
-
10
-
11
-
 12
12 -
 13
13 -
 14
14 -
 15
15 -
 16
16 -
 17
17 -
 18
18 -
 19
19 -
 20
20 -
 21
21 -
 22
22 -
 23
23 -
 24
24 -
 25
25 -
 26
26 -
 27
27 -
 28
28 -
 29
29 -
 30
30 -
 31
31 -
 32
32 -
33
-
34
-
35
-
36
-
37
-
38
-
39
-
40
-
41
-
42
-
43
-
44
-
45
-
46
-
47
-
48
-
49
-
50
-
51
-
52
-
53
-
54
-
55
-
56
-
57
-
58
-
59
-
60
-
61
-
62
-
63
-
64
-
65
-
66
-
67
-
68
-
69
-
70
-
71
-
72
-
73
-
74
-
75
-
76
-
77
-
78
-
79
-
80
-
81
-
82
-
83
-
84
-
85
-
86
-
87
-
88
-
89
-
90
-
91
-
92
-
93
-
94
-
95
-
96
-
97
-
98
-
99
-
100
-
101
-
102
-
103
-
104
-
105
-
106
-
107
-
108
-
109
-
110
-
111
-
112
-
113
-
114
-
115
-
116
-
117
-
118
-
119
-
120
-
121
-
122
-
123
-
124
-
125
-
126
-
127
-
128
-
129
-
130
-
131
-
132
-
133
-
134
-
135
-
136
-
137
-
138
-
139
-
140
-
141
-
142
-
143
-
144
-
145
-
146
-
147
-
148
-
149
-
150
-
151
-
152
-
153
-
154
-
155
-
156
-
157
-
158
-
159
-
160
-
161
-
162
-
163
-
164
-
165
-
166
-
167
-
168
-
169
-
170
-
171
-
172
-
173
-
174
-
175
-
176
-
177
-
178
-
179
-
180
-
181
-
182
-
183
-
184
-
185
-
186
-
187
-
188
-
189
-
190
-
191
-
192
-
193
-
194
-
195
-
196
-
197
-
198
-
199
-
200
-
201
-
202
-
203
-
204
-
205
-
206
-
207
-
208
-
209
-
210
-
211
-
212
-
213
-
214
-
215
-
216
-
217
-
218
-
219
-
220
-
221
-
222
-
223
-
224
-
225
-
226
-
227
-
228
-
229
-
230
-
231
-
232
-
233
-
234
-
235
-
236
-
237
-
238
-
239
-
240
-
241
-
242
-
243
-
244
-
245
-
246
-
247
-
248
-
249
-
250
-
251
-
252
-
253
-
254
-
255
-
256
-
257
-
258
-
259
-
260
-
261
-
262
-
263
-
264
-
265
-
266
-
267
-
268
-
269
-
270
-
271
-
272
-
273
-
274
-
275
-
276
-
277
-
278
-
279
-
280
-
281
-
282
-
283
-
284
-
285
-
286
-
287
-
288
-
289
-
290
-
291
-
292
-
293
-
294
-
295
-
296
-
297
-
298
-
299
-
300
-
301
-
302
-
303
-
304
-
305
-
306
-
307
-
308
-
309
-
310
-
311
-
312
-
313
-
314
-
315
-
316
-
317
-
318
-
319
-
320
-
321
-
322
-
323
-
324
-
325
-
326
-
327
-
328
-
329
-
330
-
331
-
332
-
333
-
334
-
335
-
336
-
337
-
338
-
339
-
340
-
341
-
342
-
343
-
344
-
345
-
346
-
347
-
348
-
349
-
350
-
351
-
352
-
353
-
354
-
355
-
356
-
357
-
358
-
359
-
360
-
361
-
362
-
363
-
364
-
365
-
366
-
367
-
368
-
369
-
370
-
371
-
372
-
373
-
374
-
375
-
376
-
377
-
378
-
379
-
380
-
381
-
382
-
383
-
384
-
385
-
386
-
387
-
388
-
389
-
390
-
391
-
392
-
393
-
394
-
395
-
396
 |
 |

HSBC HOLDINGS PLC
Report of the Directors: Operating and Financial Review (continued)
Financial summary > Group performance
20
Net fee income from sales of investment
products in Asia and Europe increased, driven by a
stronger investment performance in funds and
improved customer sentiment which led to higher
volumes.
Credit facilities fees also rose, notably in Asia,
as a result of an increase in loan syndication
transactions completed during the year.
Net fee income from trade finance also increased,
particularly in Asia, reflecting a rise in trade activity.
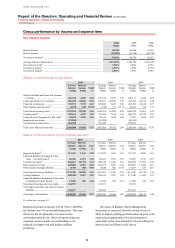
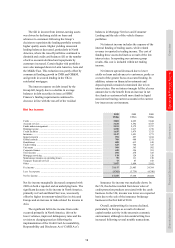
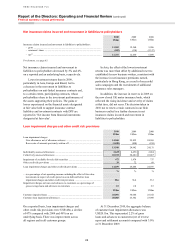
Net trading income
2010
US$m
2009
US$m
2008
US$m
Trading activities ........................................................................................................ 5,708 5,312 2,988
Net interest income on trading activities .................................................................... 2,530 3,627 5,713
Other trading income – hedge ineffectiveness:
– on cash flow hedges ............................................................................................ (9) 90 (40)
– on fair value hedges ............................................................................................ 38 (45) 5
Non-qualifying hedges ............................................................................................... (1,057) 951 (1,122)
Losses on Bernard L. Madoff Investment Securities LLC fraud ............................... – (72) (984)
Net trading income30,31 ................................................................................................ 7,210 9,863 6,560
For footnotes, see page 83.
Reported net trading income was US$7.2bn, 27%
lower than in 2009. On an underlying basis, net
trading income declined by 28% due to adverse
movements on non-qualifying hedges and lower
income from trading activities.
A US$1.1bn adverse fair value movement was
reported on non-qualifying hedges compared with a
favourable fair value movement of US$954m in 2009.
These instruments are derivatives entered into as part
of a documented interest rate management strategy
for which hedge accounting was not, or could not be,
applied. They are principally cross-currency and
interest rate swaps used to economically hedge fixed
rate debt issued by HSBC Holdings, floating rate debt
issued by HSBC Finance and certain operating leased
assets. The loss recognised on non-qualifying hedges
was a result of fair value losses on these instruments,
driven by the decrease in long-term US interest rates
relative to sterling and euro rates. In HSBC Finance,
the volume of non-qualifying hedge positions also
increased as the duration of the mortgage book
lengthened and swaps were used to align more closely
the duration of the funding liabilities. The size and
direction of the changes in fair value of non-
qualifying hedges which are recognised in the income
statement can be volatile from year to year, but do not
alter the cash flows expected as part of the
documented interest rate management strategy for
both the instruments and the underlying economically
hedged assets and liabilities.
The remaining decline in net trading income
was driven by increased competition and reduced
margins across core products. European sovereign
debt concerns and increased economic uncertainty
resulted in less favourable market conditions
compared with 2009.
In the Credit business, corporate bond trading
volumes remained robust following investment in
electronic trading capabilities, though revenues were
affected as margins declined and credit spread
movements were more favourable in 2009. This was
partly offset by gains on the legacy portfolio which
included a net release of write-downs on legacy
positions and monoline credit exposures of
US$429m. This compared with a reported
write-down of US$331m in 2009.
Rates income decreased, reflecting reduced
margins and increased risk aversion from customers
due to economic uncertainty. Turmoil in the eurozone
led to sovereign debt downgrades and falling asset
prices in certain European countries, leading to
lower revenues in the trading portfolio. These factors
were partly offset by a small favourable fair value
movement on structured liabilities, compared with
an adverse movement in 2009.
Lower net trading income was driven by a
US$2.0bn adverse movement on non-
qualifying hedges from 2009.
Performance in the Foreign Exchange business
remained strong, although was affected by a
competitive trading environment and tighter bid-
offer spreads as competitors sought to rebuild their
businesses. In addition, revenues fell as market
volatility declined from the exceptional levels seen
in early 2009.
The Equities business continued to increase
market share in its target markets, following
investment in the equities platform. However, core
revenues fell, as overall market volumes and margins
declined.