HSBC 2010 Annual Report Download - page 64
Download and view the complete annual report
Please find page 64 of the 2010 HSBC annual report below. You can navigate through the pages in the report by either clicking on the pages listed below, or by using the keyword search tool below to find specific information within the annual report.-
 1
1 -
2
-
3
-
4
-
5
-
6
-
7
-
8
-
9
-
10
-
11
-
12
-
13
-
14
-
15
-
16
-
17
-
18
-
19
-
20
-
21
-
22
-
23
-
24
-
25
-
26
-
27
-
28
-
29
-
30
-
31
-
32
-
33
-
34
-
35
-
36
-
37
-
38
-
39
-
40
-
41
-
42
-
43
-
44
-
45
-
46
-
47
-
48
-
49
-
50
-
51
-
52
-
53
-
 54
54 -
 55
55 -
 56
56 -
 57
57 -
 58
58 -
 59
59 -
 60
60 -
 61
61 -
 62
62 -
 63
63 -
 64
64 -
 65
65 -
 66
66 -
 67
67 -
 68
68 -
 69
69 -
 70
70 -
 71
71 -
 72
72 -
 73
73 -
 74
74 -
75
-
76
-
77
-
78
-
79
-
80
-
81
-
82
-
83
-
84
-
85
-
86
-
87
-
88
-
89
-
90
-
91
-
92
-
93
-
94
-
95
-
96
-
97
-
98
-
99
-
100
-
101
-
102
-
103
-
104
-
105
-
106
-
107
-
108
-
109
-
110
-
111
-
112
-
113
-
114
-
115
-
116
-
117
-
118
-
119
-
120
-
121
-
122
-
123
-
124
-
125
-
126
-
127
-
128
-
129
-
130
-
131
-
132
-
133
-
134
-
135
-
136
-
137
-
138
-
139
-
140
-
141
-
142
-
143
-
144
-
145
-
146
-
147
-
148
-
149
-
150
-
151
-
152
-
153
-
154
-
155
-
156
-
157
-
158
-
159
-
160
-
161
-
162
-
163
-
164
-
165
-
166
-
167
-
168
-
169
-
170
-
171
-
172
-
173
-
174
-
175
-
176
-
177
-
178
-
179
-
180
-
181
-
182
-
183
-
184
-
185
-
186
-
187
-
188
-
189
-
190
-
191
-
192
-
193
-
194
-
195
-
196
-
197
-
198
-
199
-
200
-
201
-
202
-
203
-
204
-
205
-
206
-
207
-
208
-
209
-
210
-
211
-
212
-
213
-
214
-
215
-
216
-
217
-
218
-
219
-
220
-
221
-
222
-
223
-
224
-
225
-
226
-
227
-
228
-
229
-
230
-
231
-
232
-
233
-
234
-
235
-
236
-
237
-
238
-
239
-
240
-
241
-
242
-
243
-
244
-
245
-
246
-
247
-
248
-
249
-
250
-
251
-
252
-
253
-
254
-
255
-
256
-
257
-
258
-
259
-
260
-
261
-
262
-
263
-
264
-
265
-
266
-
267
-
268
-
269
-
270
-
271
-
272
-
273
-
274
-
275
-
276
-
277
-
278
-
279
-
280
-
281
-
282
-
283
-
284
-
285
-
286
-
287
-
288
-
289
-
290
-
291
-
292
-
293
-
294
-
295
-
296
-
297
-
298
-
299
-
300
-
301
-
302
-
303
-
304
-
305
-
306
-
307
-
308
-
309
-
310
-
311
-
312
-
313
-
314
-
315
-
316
-
317
-
318
-
319
-
320
-
321
-
322
-
323
-
324
-
325
-
326
-
327
-
328
-
329
-
330
-
331
-
332
-
333
-
334
-
335
-
336
-
337
-
338
-
339
-
340
-
341
-
342
-
343
-
344
-
345
-
346
-
347
-
348
-
349
-
350
-
351
-
352
-
353
-
354
-
355
-
356
-
357
-
358
-
359
-
360
-
361
-
362
-
363
-
364
-
365
-
366
-
367
-
368
-
369
-
370
-
371
-
372
-
373
-
374
-
375
-
376
-
377
-
378
-
379
-
380
-
381
-
382
-
383
-
384
-
385
-
386
-
387
-
388
-
389
-
390
-
391
-
392
-
393
-
394
-
395
-
396
 |
 |

HSBC HOLDINGS PLC
Report of the Directors: Operating and Financial Review (continued)
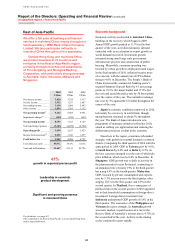
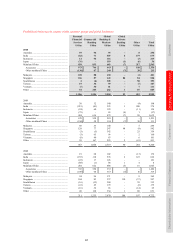
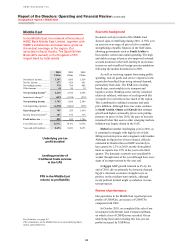
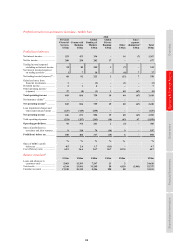
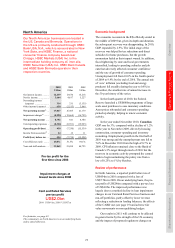
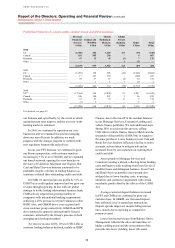
Geographical regions > Rest of Asia-Pacific
62
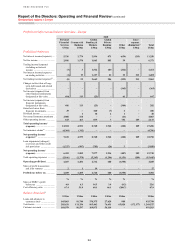
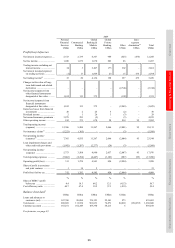
Review of performance
Our operations in the Rest of Asia-Pacific region
reported pre-tax profits of US$5.9bn compared with
US$4.2bn in 2009, an increase of 41%. Reported
profits included an accounting gain of US$188m
arising from the dilution of HSBC’s shareholding
in Ping An Insurance following its issue of share
capital to a third party in 2010. On an underlying
basis, which excludes this dilution gain, pre-tax profit
rose by 29% as business volumes increased across
many countries and all customer groups as the
economic environment in the region improved.
The economic performance of the region was
reflected in a recovery in trade volumes, an increase
in our customers’ appetite for investment-related
products, strong growth in lending balances and
a significant decline in loan impairment charges.
All these factors contributed to an increase in our
profitability, as did a rise in our share of profit from
associates in mainland China. Operating expenses
increased to support this business growth.
During 2010 we continued to target growth,
particularly in the key regional markets of mainland
China, India, Indonesia, Singapore, Malaysia and
Australia. We consolidated our position as the leading
foreign bank in mainland China with 106 outlets in
27 cities, 16 rural bank outlets and 38 Hang Seng
Bank outlets in 13 cities. We maintained our
leadership in the development of renminbi products
and now have renminbi capabilities in 36 countries
across all six continents. In July 2010 we agreed to
acquire a substantial part of The Royal Bank of
Scotland Group plc’s commercial and retail
businesses in India. In Malaysia, four additional
Amanah branches were opened.
Our focus on higher value segments was
reflected in the Premier customer base in the region
which grew by 33% while the Advance proposition
was launched in nine markets, exceeding 660,000
customers by the year end. In CMB, we continued to
build on our international connectivity, with
cross-regional referrals nearly doubling as we
pursued our objective to be the leading international
business bank.
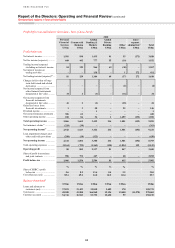
Net interest income was broadly in line with
2009 as strong loan growth was offset by narrower
asset spreads in the face of strong competition.
Higher average lending balances resulted from
business growth in GB&M and CMB across the
region, reflecting the recovery in trade activity.
Average PFS lending balances also rose, mainly in
the mortgage book, most notably in Australia,
Singapore and Malaysia, as well as in Taiwan and
mainland China, supported by successful marketing
campaigns.
The narrower asset spreads were also the
consequence of a shift to lower risk customers
following the managed reduction of certain
unsecured lending portfolios, particularly in India.
Average customer deposit balances grew,
primarily in mainland China, Australia and
Singapore as a result of a targeted strategy to expand
the customer base.
Balance Sheet Management income declined
from 2009 as higher yielding trades matured, interest
rates generally remained low and yield curves
flattened.
Net fee income was 16% higher. An
improvement in equity markets and inflows of funds
under management drove a significant increase in
fee income in GB&M while, in CMB, the recovery
in trade activity led to higher trade-related fees and
credit facilities. In PFS, fee income also rose from
the increased sales of investment and insurance
products.
Net trading income declined by 7%, as reduced
market volatility led to lower Rates trading income.
In India, trading income further declined as gains
achieved in 2009 from narrowing bond yields did not
recur while in South Korea, lower trading revenues
reflected the non-recurrence of one-off gains
recognised in 2009. These were partly offset by
higher foreign exchange income in mainland China
and wider margins in India as a result of strong client
volumes in the growing economies and a rise in
interest income from trading activities resulting from
increased holdings of debt securities.
Net income from financial instruments
designated at fair value fell by US$95m. The
movement was due to lower revaluation gains
in 2010 than in 2009 on assets held to support
insurance contracts. To the extent that these lower
investment gains were attributed to policyholders,
there was a corresponding decrease in ‘Net insurance
claims incurred and movement in liabilities to
policyholders’.
Gains less losses from financial investments
were US$141m compared with losses of US$15m
in 2009, as a result of a gain on disposal of an equity
investment in a Singaporean property company
and gains on sales of other available-for-sale
investments. Impairments reported in 2009 did not
recur in 2010.