HSBC 2010 Annual Report Download - page 23
Download and view the complete annual report
Please find page 23 of the 2010 HSBC annual report below. You can navigate through the pages in the report by either clicking on the pages listed below, or by using the keyword search tool below to find specific information within the annual report.-
 1
1 -
2
-
3
-
4
-
5
-
6
-
7
-
8
-
9
-
10
-
11
-
12
-
 13
13 -
 14
14 -
 15
15 -
 16
16 -
 17
17 -
 18
18 -
 19
19 -
 20
20 -
 21
21 -
 22
22 -
 23
23 -
 24
24 -
 25
25 -
 26
26 -
 27
27 -
 28
28 -
 29
29 -
 30
30 -
 31
31 -
 32
32 -
 33
33 -
34
-
35
-
36
-
37
-
38
-
39
-
40
-
41
-
42
-
43
-
44
-
45
-
46
-
47
-
48
-
49
-
50
-
51
-
52
-
53
-
54
-
55
-
56
-
57
-
58
-
59
-
60
-
61
-
62
-
63
-
64
-
65
-
66
-
67
-
68
-
69
-
70
-
71
-
72
-
73
-
74
-
75
-
76
-
77
-
78
-
79
-
80
-
81
-
82
-
83
-
84
-
85
-
86
-
87
-
88
-
89
-
90
-
91
-
92
-
93
-
94
-
95
-
96
-
97
-
98
-
99
-
100
-
101
-
102
-
103
-
104
-
105
-
106
-
107
-
108
-
109
-
110
-
111
-
112
-
113
-
114
-
115
-
116
-
117
-
118
-
119
-
120
-
121
-
122
-
123
-
124
-
125
-
126
-
127
-
128
-
129
-
130
-
131
-
132
-
133
-
134
-
135
-
136
-
137
-
138
-
139
-
140
-
141
-
142
-
143
-
144
-
145
-
146
-
147
-
148
-
149
-
150
-
151
-
152
-
153
-
154
-
155
-
156
-
157
-
158
-
159
-
160
-
161
-
162
-
163
-
164
-
165
-
166
-
167
-
168
-
169
-
170
-
171
-
172
-
173
-
174
-
175
-
176
-
177
-
178
-
179
-
180
-
181
-
182
-
183
-
184
-
185
-
186
-
187
-
188
-
189
-
190
-
191
-
192
-
193
-
194
-
195
-
196
-
197
-
198
-
199
-
200
-
201
-
202
-
203
-
204
-
205
-
206
-
207
-
208
-
209
-
210
-
211
-
212
-
213
-
214
-
215
-
216
-
217
-
218
-
219
-
220
-
221
-
222
-
223
-
224
-
225
-
226
-
227
-
228
-
229
-
230
-
231
-
232
-
233
-
234
-
235
-
236
-
237
-
238
-
239
-
240
-
241
-
242
-
243
-
244
-
245
-
246
-
247
-
248
-
249
-
250
-
251
-
252
-
253
-
254
-
255
-
256
-
257
-
258
-
259
-
260
-
261
-
262
-
263
-
264
-
265
-
266
-
267
-
268
-
269
-
270
-
271
-
272
-
273
-
274
-
275
-
276
-
277
-
278
-
279
-
280
-
281
-
282
-
283
-
284
-
285
-
286
-
287
-
288
-
289
-
290
-
291
-
292
-
293
-
294
-
295
-
296
-
297
-
298
-
299
-
300
-
301
-
302
-
303
-
304
-
305
-
306
-
307
-
308
-
309
-
310
-
311
-
312
-
313
-
314
-
315
-
316
-
317
-
318
-
319
-
320
-
321
-
322
-
323
-
324
-
325
-
326
-
327
-
328
-
329
-
330
-
331
-
332
-
333
-
334
-
335
-
336
-
337
-
338
-
339
-
340
-
341
-
342
-
343
-
344
-
345
-
346
-
347
-
348
-
349
-
350
-
351
-
352
-
353
-
354
-
355
-
356
-
357
-
358
-
359
-
360
-
361
-
362
-
363
-
364
-
365
-
366
-
367
-
368
-
369
-
370
-
371
-
372
-
373
-
374
-
375
-
376
-
377
-
378
-
379
-
380
-
381
-
382
-
383
-
384
-
385
-
386
-
387
-
388
-
389
-
390
-
391
-
392
-
393
-
394
-
395
-
396
 |
 |

21
Overview Operating & Financial Review Governance Financial Statements Shareholder Information
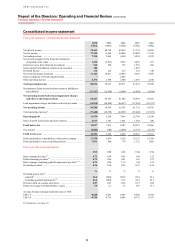
Trading income benefited from foreign
exchange gains on trading assets held as economic
hedges of foreign currency debt designated at fair
value compared with losses on these instruments
in 2009. These gains were largely offset by
corresponding losses reported in ‘Net income from
financial instruments designated at fair value’.
Net interest income earned on trading activities
decreased by 30%, driven by reduced holdings of
debt securities. The cost of internally funding these
assets also declined, but this interest expense is
reported under ‘Net interest income’ and excluded
from net trading income.
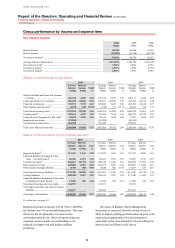
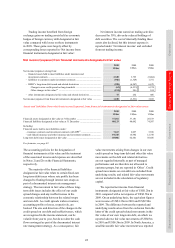
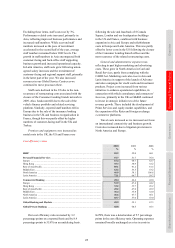
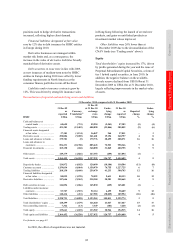
Net income/(expense) from financial instruments designated at fair value
2010
US$m
2009
US$m
2008
US$m
Net income/(expense) arising from:
– financial assets held to meet liabilities under insurance and
investment contracts ........................................................................................... 2,349 3,793 (5,064)
– liabilities to customers under investment contracts ........................................... (946) (1,329) 1,751
– HSBC’s long-term debt issued and related derivatives ..................................... (258) (6,247) 6,679
Change in own credit spread on long-term debt ........................................... (63) (6,533) 6,570
Other changes in fair value32 ......................................................................... (195) 286 109
– other instruments designated at fair value and related derivatives .................... 75 252 486
Net income/(expense) from financial instruments designated at fair value .............. 1,220 (3,531) 3,852
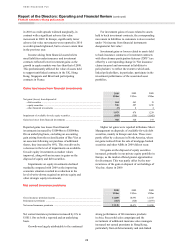
Assets and liabilities from which net income/(expense) from financial instruments designated at fair value arose
2010
US$m
2009
US$m
2008
US$m
Financial assets designated at fair value at 31 December .......................................... 37,011 37,181 28,533
Financial liabilities designated at fair value at 31 December .................................... 88,133 80,092 74,587
Including:
Financial assets held to meet liabilities under:
– insurance contracts and investment contracts with DPF33 .................................. 7,167 6,097 5,556
– unit-linked insurance and other insurance and investment contracts ................. 19,725 16,982 12,758
Long-term debt issues designated at fair value .......................................................... 69,906 62,641 58,686
For footnotes, see page 83.
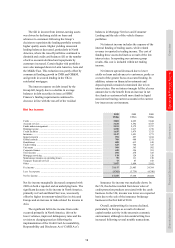
The accounting policies for the designation of
financial instruments at fair value and the treatment
of the associated income and expenses are described
in Notes 2i and 2b on the Financial Statements,
respectively.
The majority of the financial liabilities
designated at fair value relate to certain fixed-rate
long-term debt issues whose rate profile has been
changed to floating through interest rate swaps as
part of a documented interest rate management
strategy. The movement in fair value of these long-
term debt issues includes the effect of our credit
spread changes and any ineffectiveness in the
economic relationship between the related swaps
and own debt. As credit spreads widen or narrow,
accounting profits or losses, respectively, are
booked. The size and direction of the changes in the
credit spread on our debt and ineffectiveness, which
are recognised in the income statement, can be
volatile from year to year, but do not alter the cash
flows envisaged as part of the documented interest
rate management strategy. As a consequence, fair
value movements arising from changes in our own
credit spread on long-term debt and other fair value
movements on the debt and related derivatives
are not regarded internally as part of managed
performance and are therefore not allocated to
customer groups, but are reported in ‘Other’. Credit
spread movements on own debt are excluded from
underlying results, and related fair value movements
are not included in the calculation of regulatory
capital.
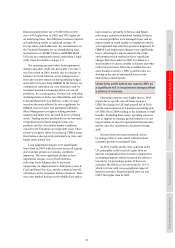
We reported net income from financial
instruments designated at fair value of US$1.2bn in
2010 compared with a net expense of US$3.5bn in
2009. On an underlying basis, the equivalent figures
were income of US$1.3bn in 2010 and US$2.9bn
in 2009. The difference between the reported and
underlying results arises from the exclusion from the
latter of the credit spread-related movements in the
fair value of our own long-term debt, on which we
reported adverse fair value movements of US$63m
in 2010 and US$6.5bn in 2009. In North America, a
small favourable fair value movement was reported