HSBC 2010 Annual Report Download - page 61
Download and view the complete annual report
Please find page 61 of the 2010 HSBC annual report below. You can navigate through the pages in the report by either clicking on the pages listed below, or by using the keyword search tool below to find specific information within the annual report.-
 1
1 -
2
-
3
-
4
-
5
-
6
-
7
-
8
-
9
-
10
-
11
-
12
-
13
-
14
-
15
-
16
-
17
-
18
-
19
-
20
-
21
-
22
-
23
-
24
-
25
-
26
-
27
-
28
-
29
-
30
-
31
-
32
-
33
-
34
-
35
-
36
-
37
-
38
-
39
-
40
-
41
-
42
-
43
-
44
-
45
-
46
-
47
-
48
-
49
-
50
-
 51
51 -
 52
52 -
 53
53 -
 54
54 -
 55
55 -
 56
56 -
 57
57 -
 58
58 -
 59
59 -
 60
60 -
 61
61 -
 62
62 -
 63
63 -
 64
64 -
 65
65 -
 66
66 -
 67
67 -
 68
68 -
 69
69 -
 70
70 -
 71
71 -
72
-
73
-
74
-
75
-
76
-
77
-
78
-
79
-
80
-
81
-
82
-
83
-
84
-
85
-
86
-
87
-
88
-
89
-
90
-
91
-
92
-
93
-
94
-
95
-
96
-
97
-
98
-
99
-
100
-
101
-
102
-
103
-
104
-
105
-
106
-
107
-
108
-
109
-
110
-
111
-
112
-
113
-
114
-
115
-
116
-
117
-
118
-
119
-
120
-
121
-
122
-
123
-
124
-
125
-
126
-
127
-
128
-
129
-
130
-
131
-
132
-
133
-
134
-
135
-
136
-
137
-
138
-
139
-
140
-
141
-
142
-
143
-
144
-
145
-
146
-
147
-
148
-
149
-
150
-
151
-
152
-
153
-
154
-
155
-
156
-
157
-
158
-
159
-
160
-
161
-
162
-
163
-
164
-
165
-
166
-
167
-
168
-
169
-
170
-
171
-
172
-
173
-
174
-
175
-
176
-
177
-
178
-
179
-
180
-
181
-
182
-
183
-
184
-
185
-
186
-
187
-
188
-
189
-
190
-
191
-
192
-
193
-
194
-
195
-
196
-
197
-
198
-
199
-
200
-
201
-
202
-
203
-
204
-
205
-
206
-
207
-
208
-
209
-
210
-
211
-
212
-
213
-
214
-
215
-
216
-
217
-
218
-
219
-
220
-
221
-
222
-
223
-
224
-
225
-
226
-
227
-
228
-
229
-
230
-
231
-
232
-
233
-
234
-
235
-
236
-
237
-
238
-
239
-
240
-
241
-
242
-
243
-
244
-
245
-
246
-
247
-
248
-
249
-
250
-
251
-
252
-
253
-
254
-
255
-
256
-
257
-
258
-
259
-
260
-
261
-
262
-
263
-
264
-
265
-
266
-
267
-
268
-
269
-
270
-
271
-
272
-
273
-
274
-
275
-
276
-
277
-
278
-
279
-
280
-
281
-
282
-
283
-
284
-
285
-
286
-
287
-
288
-
289
-
290
-
291
-
292
-
293
-
294
-
295
-
296
-
297
-
298
-
299
-
300
-
301
-
302
-
303
-
304
-
305
-
306
-
307
-
308
-
309
-
310
-
311
-
312
-
313
-
314
-
315
-
316
-
317
-
318
-
319
-
320
-
321
-
322
-
323
-
324
-
325
-
326
-
327
-
328
-
329
-
330
-
331
-
332
-
333
-
334
-
335
-
336
-
337
-
338
-
339
-
340
-
341
-
342
-
343
-
344
-
345
-
346
-
347
-
348
-
349
-
350
-
351
-
352
-
353
-
354
-
355
-
356
-
357
-
358
-
359
-
360
-
361
-
362
-
363
-
364
-
365
-
366
-
367
-
368
-
369
-
370
-
371
-
372
-
373
-
374
-
375
-
376
-
377
-
378
-
379
-
380
-
381
-
382
-
383
-
384
-
385
-
386
-
387
-
388
-
389
-
390
-
391
-
392
-
393
-
394
-
395
-
396
 |
 |

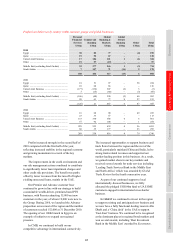
59
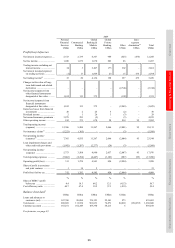
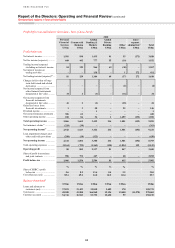
Overview Operating & Financial Review Governance Financial Statements Shareholder Information
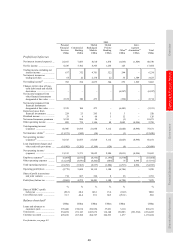
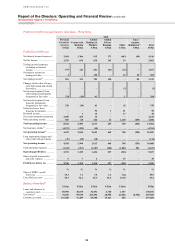
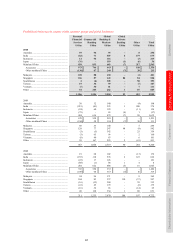
2009
Personal
Financial
Services
US$m
Commercial
Banking
US$m
Global
Banking &
Markets
US$m
Global
Private
Banking
US$m
Other
US$m
Inter-
segment
elimination56
US$m
Total
US$m
Profit/(loss) before tax
Net interest income/(expense) ..... 2,577 938 1,150 212 (558) (124) 4,195
Net fee income ............................ 1,410 530 563 125 41 – 2,669
Trading income/(expense)
excluding net interest income 186 92 792 91 (93) – 1,068
Net interest income on trading
activities .................................. 3 – 16 – 14 124 157
Net trading income/(expense)49 .. 189 92 808 91 (79) 124 1,225
Changes in fair value of long-
term debt issued and related
derivatives .............................. – – – – (3) – (3)
Net income/(expense) from
other financial instruments
designated at fair value ........... 707 (46) 138 – (11) – 788
Net income/(expense) from
financial instruments
designated at fair value ........... 707 (46) 138 – (14) – 785
Gains less losses from
financial investments .............. 80 18 (108) – 19 – 9
Dividend income ......................... 1 1 10 – 16 – 28
Net earned insurance
premiums ................................ 3,161 500 13 – – – 3,674
Other operating income .............. 346 64 59 10 1,062 (267) 1,274
Total operating income ............... 8,471 2,097 2,633 438 487 (267) 13,859
Net insurance claims57 ................ (3,979) (404) (9) – – – (4,392)
Net operating income46 ............... 4,492 1,693 2,624 438 487 (267) 9,467
Loan impairment (charges)/
recoveries and other credit
risk provisions ........................ (203) (168) (131) 1 1 – (500)
Net operating income ................. 4,289 1,525 2,493 439 488 (267) 8,967
Total operating expenses ............ (1,566) (570) (987) (242) (848) 267 (3,946)
Operating profit/(loss) ................ 2,723 955 1,506 197 (360) – 5,021
Share of profit in associates
and joint ventures ................... 5 1 1 – 1 – 8
Profit/(loss) before tax ................ 2,728 956 1,507 197 (359) – 5,029
% % % % % %
Share of HSBC’s profit
before tax ................................ 38.5 13.5 21.3 2.8 (5.1) 71.0
Cost efficiency ratio ................... 34.9 33.7 37.6 55.3 174.1 41.7
Balance sheet data45
US$m US$m US$m US$m US$m US$m
Loans and advances to
customers (net) ....................... 43,869 28,217 21,991 3,361 1,943 99,381
Total assets61 ............................... 83,497 34,743 217,146 20,353 52,508 (9,004) 399,243
Customer accounts ...................... 166,445 62,146 26,650 19,474 726 275,441
For footnotes, see page 83.