HSBC 2010 Annual Report Download - page 283
Download and view the complete annual report
Please find page 283 of the 2010 HSBC annual report below. You can navigate through the pages in the report by either clicking on the pages listed below, or by using the keyword search tool below to find specific information within the annual report.-
 1
1 -
2
-
3
-
4
-
5
-
6
-
7
-
8
-
9
-
10
-
11
-
12
-
13
-
14
-
15
-
16
-
17
-
18
-
19
-
20
-
21
-
22
-
23
-
24
-
25
-
26
-
27
-
28
-
29
-
30
-
31
-
32
-
33
-
34
-
35
-
36
-
37
-
38
-
39
-
40
-
41
-
42
-
43
-
44
-
45
-
46
-
47
-
48
-
49
-
50
-
51
-
52
-
53
-
54
-
55
-
56
-
57
-
58
-
59
-
60
-
61
-
62
-
63
-
64
-
65
-
66
-
67
-
68
-
69
-
70
-
71
-
72
-
73
-
74
-
75
-
76
-
77
-
78
-
79
-
80
-
81
-
82
-
83
-
84
-
85
-
86
-
87
-
88
-
89
-
90
-
91
-
92
-
93
-
94
-
95
-
96
-
97
-
98
-
99
-
100
-
101
-
102
-
103
-
104
-
105
-
106
-
107
-
108
-
109
-
110
-
111
-
112
-
113
-
114
-
115
-
116
-
117
-
118
-
119
-
120
-
121
-
122
-
123
-
124
-
125
-
126
-
127
-
128
-
129
-
130
-
131
-
132
-
133
-
134
-
135
-
136
-
137
-
138
-
139
-
140
-
141
-
142
-
143
-
144
-
145
-
146
-
147
-
148
-
149
-
150
-
151
-
152
-
153
-
154
-
155
-
156
-
157
-
158
-
159
-
160
-
161
-
162
-
163
-
164
-
165
-
166
-
167
-
168
-
169
-
170
-
171
-
172
-
173
-
174
-
175
-
176
-
177
-
178
-
179
-
180
-
181
-
182
-
183
-
184
-
185
-
186
-
187
-
188
-
189
-
190
-
191
-
192
-
193
-
194
-
195
-
196
-
197
-
198
-
199
-
200
-
201
-
202
-
203
-
204
-
205
-
206
-
207
-
208
-
209
-
210
-
211
-
212
-
213
-
214
-
215
-
216
-
217
-
218
-
219
-
220
-
221
-
222
-
223
-
224
-
225
-
226
-
227
-
228
-
229
-
230
-
231
-
232
-
233
-
234
-
235
-
236
-
237
-
238
-
239
-
240
-
241
-
242
-
243
-
244
-
245
-
246
-
247
-
248
-
249
-
250
-
251
-
252
-
253
-
254
-
255
-
256
-
257
-
258
-
259
-
260
-
261
-
262
-
263
-
264
-
265
-
266
-
267
-
268
-
269
-
270
-
271
-
272
-
 273
273 -
 274
274 -
 275
275 -
 276
276 -
 277
277 -
 278
278 -
 279
279 -
 280
280 -
 281
281 -
 282
282 -
 283
283 -
 284
284 -
 285
285 -
 286
286 -
 287
287 -
 288
288 -
 289
289 -
 290
290 -
 291
291 -
 292
292 -
 293
293 -
294
-
295
-
296
-
297
-
298
-
299
-
300
-
301
-
302
-
303
-
304
-
305
-
306
-
307
-
308
-
309
-
310
-
311
-
312
-
313
-
314
-
315
-
316
-
317
-
318
-
319
-
320
-
321
-
322
-
323
-
324
-
325
-
326
-
327
-
328
-
329
-
330
-
331
-
332
-
333
-
334
-
335
-
336
-
337
-
338
-
339
-
340
-
341
-
342
-
343
-
344
-
345
-
346
-
347
-
348
-
349
-
350
-
351
-
352
-
353
-
354
-
355
-
356
-
357
-
358
-
359
-
360
-
361
-
362
-
363
-
364
-
365
-
366
-
367
-
368
-
369
-
370
-
371
-
372
-
373
-
374
-
375
-
376
-
377
-
378
-
379
-
380
-
381
-
382
-
383
-
384
-
385
-
386
-
387
-
388
-
389
-
390
-
391
-
392
-
393
-
394
-
395
-
396
 |
 |

281
Overview Operating & Financial Review Governance Financial Statements Shareholder Information
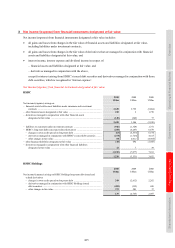
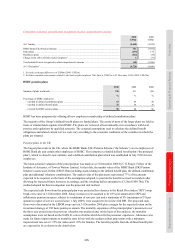
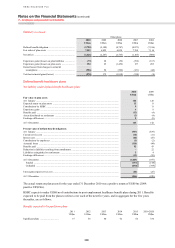
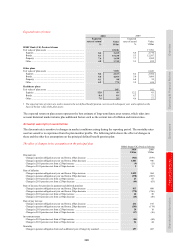
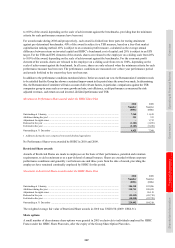
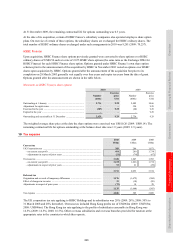
Total expense recognised in the income statement in ‘Employee compensation and benefits’
2010 2009 2008
US$m US$m US$m
Current service cost .................................................................................................... 12 11 19
Interest cost ................................................................................................................. 60 55 65
Expected return on plan assets ................................................................................... (13) (11) (12)
Past service cost .......................................................................................................... (1) (2) (2)
Gains on curtailments ................................................................................................. – (22) (31)
Gains on settlements ................................................................................................... – – (26)
Total expense .............................................................................................................. 58 31 13
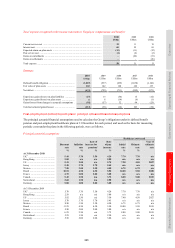
Summary
2010 2009 2008 2007 2006
US$m US$m US$m US$m US$m
Defined benefit obligation ............................................ (1,087) (937) (839) (1,038) (1,106)
Fair value of plan assets ............................................... 165 142 128 146 133
Net deficit ..................................................................... (922) (795) (711) (892) (973)
Experience gains/(losses) on plan liabilities ................ (27) 13 (34) 15 (12)
Experience gains/(losses) on plan assets ...................... 6 8 (14) (6) (1)
Gains/(losses) from changes in actuarial assumptions . (91) (57) 32 94 (25)
Total net actuarial gains/(losses) .................................. (112) (36) (16) 103 (38)
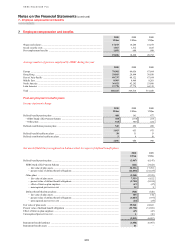
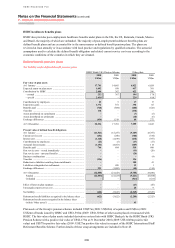
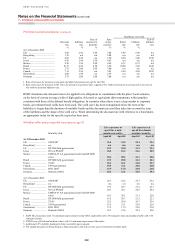
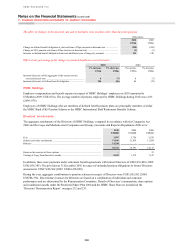
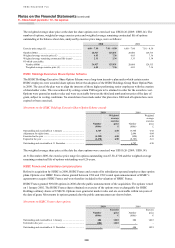
Post-employment defined benefit plans’ principal actuarial financial assumptions
The principal actuarial financial assumptions used to calculate the Group’s obligations under its defined benefit
pension and post-employment healthcare plans at 31 December for each period, and used as the basis for measuring
periodic costs under the plans in the following periods, were as follows.
Principal actuarial assumptions
Healthcare cost trend
Discount
rate
Inflation
rate
Rate of
increase for
pensions1
Rate
of pay
increase
Initial
rate
Ultimate
rate
Year of
ultimate
rate
% % % % % %
At 31 December 2010
UK2 ............................................. 5.40 3.70 3.50 4.20 7.70 7.70 n/a
Hong Kong ................................. 2.85 n/a n/a 5.00 n/a n/a n/a
US ............................................... 5.41 2.50 n/a 2.75 7.20 4.50 2027
Jersey .......................................... 5.40 3.70 3.70 5.45 n/a n/a n/a
Mexico ........................................ 7.50 3.50 3.50 4.50 6.75 6.75 n/a
Brazil ........................................... 10.51 4.50 4.50 5.50 10.00 5.50 2020
France ......................................... 4.75 2.00 2.00 3.00 n/a n/a n/a
Canada ........................................ 5.45 2.50 n/a 3.72 8.00 5.00 2015
Switzerland ................................. 2.60 1.50 n/a 2.50 n/a n/a n/a
Germany ...................................... 5.00 2.00 2.00 3.00 n/a n/a n/a
At 31 December 2009
UK2 ............................................. 5.70 3.70 3.50 4.20 7.70 7.70 n/a
Hong Kong ................................. 2.58 n/a n/a 5.00 n/a n/a n/a
US ............................................... 5.92 2.50 n/a 3.50 7.40 4.50 2027
Jersey .......................................... 5.70 3.70 3.70 5.45 n/a n/a n/a
Mexico ........................................ 8.50 3.50 3.50 4.50 6.75 6.75 n/a
Brazil ........................................... 11.25 4.50 4.50 5.50 10.00 5.50 2019
France ......................................... 5.50 2.00 2.00 3.00 n/a n/a n/a
Canada ........................................ 6.25 2.50 n/a 3.72 8.00 5.00 2015
Switzerland ................................. 3.25 1.50 n/a 2.50 n/a n/a n/a
Germany ...................................... 5.50 2.00 2.00 3.00 n/a n/a n/a