HSBC 2010 Annual Report Download - page 155
Download and view the complete annual report
Please find page 155 of the 2010 HSBC annual report below. You can navigate through the pages in the report by either clicking on the pages listed below, or by using the keyword search tool below to find specific information within the annual report.-
 1
1 -
2
-
3
-
4
-
5
-
6
-
7
-
8
-
9
-
10
-
11
-
12
-
13
-
14
-
15
-
16
-
17
-
18
-
19
-
20
-
21
-
22
-
23
-
24
-
25
-
26
-
27
-
28
-
29
-
30
-
31
-
32
-
33
-
34
-
35
-
36
-
37
-
38
-
39
-
40
-
41
-
42
-
43
-
44
-
45
-
46
-
47
-
48
-
49
-
50
-
51
-
52
-
53
-
54
-
55
-
56
-
57
-
58
-
59
-
60
-
61
-
62
-
63
-
64
-
65
-
66
-
67
-
68
-
69
-
70
-
71
-
72
-
73
-
74
-
75
-
76
-
77
-
78
-
79
-
80
-
81
-
82
-
83
-
84
-
85
-
86
-
87
-
88
-
89
-
90
-
91
-
92
-
93
-
94
-
95
-
96
-
97
-
98
-
99
-
100
-
101
-
102
-
103
-
104
-
105
-
106
-
107
-
108
-
109
-
110
-
111
-
112
-
113
-
114
-
115
-
116
-
117
-
118
-
119
-
120
-
121
-
122
-
123
-
124
-
125
-
126
-
127
-
128
-
129
-
130
-
131
-
132
-
133
-
134
-
135
-
136
-
137
-
138
-
139
-
140
-
141
-
142
-
143
-
144
-
 145
145 -
 146
146 -
 147
147 -
 148
148 -
 149
149 -
 150
150 -
 151
151 -
 152
152 -
 153
153 -
 154
154 -
 155
155 -
 156
156 -
 157
157 -
 158
158 -
 159
159 -
 160
160 -
 161
161 -
 162
162 -
 163
163 -
 164
164 -
 165
165 -
166
-
167
-
168
-
169
-
170
-
171
-
172
-
173
-
174
-
175
-
176
-
177
-
178
-
179
-
180
-
181
-
182
-
183
-
184
-
185
-
186
-
187
-
188
-
189
-
190
-
191
-
192
-
193
-
194
-
195
-
196
-
197
-
198
-
199
-
200
-
201
-
202
-
203
-
204
-
205
-
206
-
207
-
208
-
209
-
210
-
211
-
212
-
213
-
214
-
215
-
216
-
217
-
218
-
219
-
220
-
221
-
222
-
223
-
224
-
225
-
226
-
227
-
228
-
229
-
230
-
231
-
232
-
233
-
234
-
235
-
236
-
237
-
238
-
239
-
240
-
241
-
242
-
243
-
244
-
245
-
246
-
247
-
248
-
249
-
250
-
251
-
252
-
253
-
254
-
255
-
256
-
257
-
258
-
259
-
260
-
261
-
262
-
263
-
264
-
265
-
266
-
267
-
268
-
269
-
270
-
271
-
272
-
273
-
274
-
275
-
276
-
277
-
278
-
279
-
280
-
281
-
282
-
283
-
284
-
285
-
286
-
287
-
288
-
289
-
290
-
291
-
292
-
293
-
294
-
295
-
296
-
297
-
298
-
299
-
300
-
301
-
302
-
303
-
304
-
305
-
306
-
307
-
308
-
309
-
310
-
311
-
312
-
313
-
314
-
315
-
316
-
317
-
318
-
319
-
320
-
321
-
322
-
323
-
324
-
325
-
326
-
327
-
328
-
329
-
330
-
331
-
332
-
333
-
334
-
335
-
336
-
337
-
338
-
339
-
340
-
341
-
342
-
343
-
344
-
345
-
346
-
347
-
348
-
349
-
350
-
351
-
352
-
353
-
354
-
355
-
356
-
357
-
358
-
359
-
360
-
361
-
362
-
363
-
364
-
365
-
366
-
367
-
368
-
369
-
370
-
371
-
372
-
373
-
374
-
375
-
376
-
377
-
378
-
379
-
380
-
381
-
382
-
383
-
384
-
385
-
386
-
387
-
388
-
389
-
390
-
391
-
392
-
393
-
394
-
395
-
396
 |
 |

153
Overview Operating & Financial Review Governance Financial Statements Shareholder Information
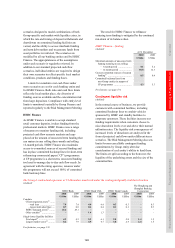
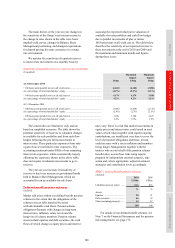
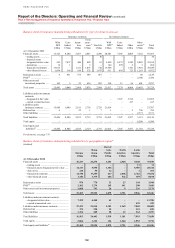
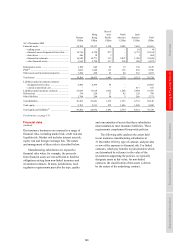
The interest rate sensitivities tabulated above
are illustrative only and are based on simplified
scenarios. The figures represent the effect of pro
forma movements in net interest income based on our
projected yield curve scenarios, HSBC Holdings’
current interest rate risk profile and assumed changes
to that profile during the next five years. Changes to
assumptions concerning the risk profile over the next
five years can have a significant impact on the net
interest income sensitivity for that period. The figures
do not take into account the effect of actions that could
be taken to mitigate this interest rate risk, however.
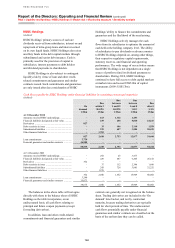
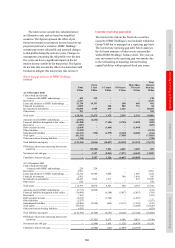
Interest repricing gap table
The interest rate risk on the fixed-rate securities
issued by HSBC Holdings is not included within the
Group VAR but is managed on a repricing gap basis.
The interest rate repricing gap table below analyses
the full term structure of interest rate mismatches
within HSBC Holdings’ balance sheet. The year-on-
year movement in the repricing gap was mainly due
to the refinancing of maturing interest bearing
capital liabilities with perpetual fixed rate issues.
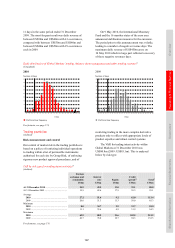
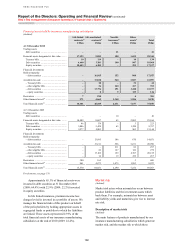
Repricing gap analysis of HSBC Holdings
(Audited)
Total
Up to
1 year 1-5 years 5-10 years
More than
10 years
Non-
interest
bearing
US$m US$m US$m US$m US$m US$m
At 31 December 2010
Cash at bank and in hand:
– balances with HSBC undertakings .............. 459 339 – – – 120
Derivatives .......................................................... 2,327 – – – – 2,327
Loans and advances to HSBC undertakings ...... 21,238 19,351 – 290 605 992
Financial investments ......................................... 2,025 – 300 900 731 94
Investments in subsidiaries ................................. 92,899 1,785 875 1,164 – 89,075
Other assets ......................................................... 393 – – – – 393
Total assets .......................................................... 119,341 21,475 1,175 2,354 1,336 93,001
Amounts owed to HSBC undertakings .............. (2,932) (2,266) – – – (666)
Financial liabilities designated at fair values ..... (16,288) – (7,184) (4,740) (3,509) (855)
Derivatives .......................................................... (827) – – – – (827)
Debt securities in issue ....................................... (2,668) – (1,664) – (1,004) –
Other liabilities ................................................... (1,232) – – – – (1,232)
Subordinated liabilities ....................................... (13,313) (750) (1,579) (2,140) (8,680) (164)
Total equity ......................................................... (81,331) – – (7,450) – (73,881)
Other non-interest bearing liabilities .................. (750) – – – – (750)
Total liabilities and equity .................................. (119,341) (3,016) (10,427) (14,330) (13,193) (78,375)
Off-balance sheet items attracting interest rate
sensitivity ........................................................ – (15,302) 7,221 4,403 3,409 269
Net interest rate risk gap ..................................... – 3,157 (2,031) (7,573) (8,448) 14,895
Cumulative interest rate gap ............................... – 3,157 1,126 (6,447) (14,895) –
At 31 December 2009
Cash at bank and in hand:
– balances with HSBC undertakings .............. 224 224 – – – –
Derivatives .......................................................... 2,981 – – – – 2,981
Loans and advances to HSBC undertakings ...... 23,212 16,980 3,084 – 1,896 1,252
Financial investments ......................................... 2,455 – – 300 1,610 545
Investments in subsidiaries ................................. 86,247 1,866 1,217 – 875 82,289
Other assets ......................................................... 674 – – – – 674
Total assets .......................................................... 115,793 19,070 4,301 300 4,381 87,741
Amounts owed to HSBC undertakings .............. (3,711) (2,898) – – – (813)
Financial liabilities designated at fair values ..... (16,909) – (6,108) (5,017) (5,015) (769)
Derivatives .......................................................... (362) – – – – (362)
Debt securities in issue ....................................... (2,839) – (1,784) – (1,055) –
Other liabilities ................................................... (1,257) – – – – (1,257)
Subordinated liabilities ....................................... (14,406) (2,850) (865) (3,117) (7,382) (192)
Total equity ......................................................... (75,876) – – – (3,650) (72,226)
Other non-interest bearing liabilities .................. (433) – – – – (433)
Total liabilities and equity .................................. (115,793) (5,748) (8,757) (8,134) (17,102) (76,052)
Off-balance sheet items attracting interest rate
sensitivity ........................................................ – (15,302) 6,275 6,306 4,051 (1,330)
Net interest rate risk gap ..................................... – (1,980) 1,819 (1,528) (8,670) 10,359
Cumulative interest rate gap ............................... – (1,980) (161) (1,689) (10,359) –