HSBC 2010 Annual Report Download - page 162
Download and view the complete annual report
Please find page 162 of the 2010 HSBC annual report below. You can navigate through the pages in the report by either clicking on the pages listed below, or by using the keyword search tool below to find specific information within the annual report.-
 1
1 -
2
-
3
-
4
-
5
-
6
-
7
-
8
-
9
-
10
-
11
-
12
-
13
-
14
-
15
-
16
-
17
-
18
-
19
-
20
-
21
-
22
-
23
-
24
-
25
-
26
-
27
-
28
-
29
-
30
-
31
-
32
-
33
-
34
-
35
-
36
-
37
-
38
-
39
-
40
-
41
-
42
-
43
-
44
-
45
-
46
-
47
-
48
-
49
-
50
-
51
-
52
-
53
-
54
-
55
-
56
-
57
-
58
-
59
-
60
-
61
-
62
-
63
-
64
-
65
-
66
-
67
-
68
-
69
-
70
-
71
-
72
-
73
-
74
-
75
-
76
-
77
-
78
-
79
-
80
-
81
-
82
-
83
-
84
-
85
-
86
-
87
-
88
-
89
-
90
-
91
-
92
-
93
-
94
-
95
-
96
-
97
-
98
-
99
-
100
-
101
-
102
-
103
-
104
-
105
-
106
-
107
-
108
-
109
-
110
-
111
-
112
-
113
-
114
-
115
-
116
-
117
-
118
-
119
-
120
-
121
-
122
-
123
-
124
-
125
-
126
-
127
-
128
-
129
-
130
-
131
-
132
-
133
-
134
-
135
-
136
-
137
-
138
-
139
-
140
-
141
-
142
-
143
-
144
-
145
-
146
-
147
-
148
-
149
-
150
-
151
-
 152
152 -
 153
153 -
 154
154 -
 155
155 -
 156
156 -
 157
157 -
 158
158 -
 159
159 -
 160
160 -
 161
161 -
 162
162 -
 163
163 -
 164
164 -
 165
165 -
 166
166 -
 167
167 -
 168
168 -
 169
169 -
 170
170 -
 171
171 -
 172
172 -
173
-
174
-
175
-
176
-
177
-
178
-
179
-
180
-
181
-
182
-
183
-
184
-
185
-
186
-
187
-
188
-
189
-
190
-
191
-
192
-
193
-
194
-
195
-
196
-
197
-
198
-
199
-
200
-
201
-
202
-
203
-
204
-
205
-
206
-
207
-
208
-
209
-
210
-
211
-
212
-
213
-
214
-
215
-
216
-
217
-
218
-
219
-
220
-
221
-
222
-
223
-
224
-
225
-
226
-
227
-
228
-
229
-
230
-
231
-
232
-
233
-
234
-
235
-
236
-
237
-
238
-
239
-
240
-
241
-
242
-
243
-
244
-
245
-
246
-
247
-
248
-
249
-
250
-
251
-
252
-
253
-
254
-
255
-
256
-
257
-
258
-
259
-
260
-
261
-
262
-
263
-
264
-
265
-
266
-
267
-
268
-
269
-
270
-
271
-
272
-
273
-
274
-
275
-
276
-
277
-
278
-
279
-
280
-
281
-
282
-
283
-
284
-
285
-
286
-
287
-
288
-
289
-
290
-
291
-
292
-
293
-
294
-
295
-
296
-
297
-
298
-
299
-
300
-
301
-
302
-
303
-
304
-
305
-
306
-
307
-
308
-
309
-
310
-
311
-
312
-
313
-
314
-
315
-
316
-
317
-
318
-
319
-
320
-
321
-
322
-
323
-
324
-
325
-
326
-
327
-
328
-
329
-
330
-
331
-
332
-
333
-
334
-
335
-
336
-
337
-
338
-
339
-
340
-
341
-
342
-
343
-
344
-
345
-
346
-
347
-
348
-
349
-
350
-
351
-
352
-
353
-
354
-
355
-
356
-
357
-
358
-
359
-
360
-
361
-
362
-
363
-
364
-
365
-
366
-
367
-
368
-
369
-
370
-
371
-
372
-
373
-
374
-
375
-
376
-
377
-
378
-
379
-
380
-
381
-
382
-
383
-
384
-
385
-
386
-
387
-
388
-
389
-
390
-
391
-
392
-
393
-
394
-
395
-
396
 |
 |
HSBC HOLDINGS PLC
Report of the Directors: Operating and Financial Review (continued)
Risk > Risk management of insurance operations > Insurance risk / Financial risks
160
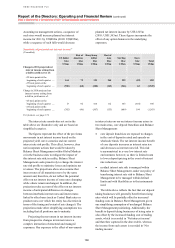
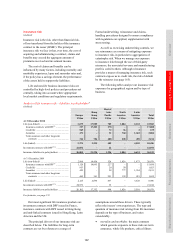
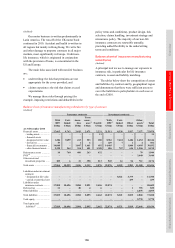
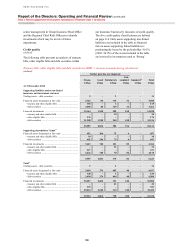
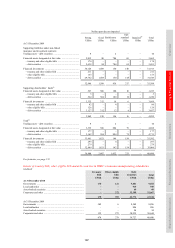
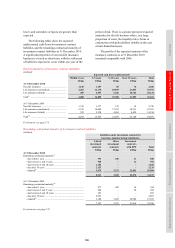
Balance sheet of insurance manufacturing subsidiaries by type of contract (continued)
Insurance contracts Investment contracts
With
DPF
Unit-
linked
Annu-
ities
Term
assur-
ance78
Non-life
With
DPF76
Unit-
linked
Other
Other
assets79 Total
US$m US$m US$m US$m US$m US$m US$m US$m US$m US$m
At 31 December 2009
Financial assets ................... 15,322 8,204 2,567 2,053 2,290 20,501 7,366 4,008 7,252 69,563
– trading assets ................ – – – – 10 – – – – 10
– financial assets
designated at fair value 599 7,837 446 482 63 5,498 6,572 1,582 2,085 25,164
– derivatives .................... 16 1 – 3 – 144 299 2 3 468
– financial investments ... 13,013 – 1,511 1,033 742 13,948 – 1,701 3,901 35,849
– other financial assets .... 1,694 366 610 535 1,475 911 495 723 1,263 8,072
Reinsurance assets ............. 6 831 376 389 467 – – – 60 2,129
PVIF80 ................................ – – – – – – – – 2,780 2,780
Other assets and
investment properties ...... 165 5 25 634 242 516 13 56 601 2,257
Total assets ......................... 15,493 9,040 2,968 3,076 2,999 21,017 7,379 4,064 10,693 76,729
Liabilities under investment
contracts:
– designated at fair value – – – – – – 7,347 3,518 – 10,865
– carried at amortised cost – – – – – – – 417 – 417
Liabilities under
insurance contracts .......... 15,450 8,986 2,811 2,718 2,728 21,014 – – – 53,707
Deferred tax ....................... 6 – 22 1 7 1 – 2 750 789
Other liabilities .................. – – – – – – – – 2,371 2,371
Total liabilities ................... 15,456 8,986 2,833 2,719 2,735 21,015 7,347 3,937 3,121 68,149
Total equity ........................ – – – – – – – – 8,580 8,580
Total equity and
liabilities82 ...................... 15,456 8,986 2,833 2,719 2,735 21,015 7,347 3,937 11,701 76,729
For footnotes, see page 174.
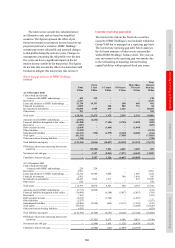
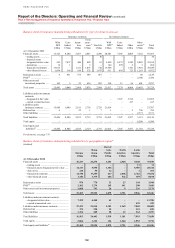
Balance sheet of insurance manufacturing subsidiaries by geographical region74
(Audited)
Europe
Hong
Kong
Rest of
Asia-
Pacific
North
America
Latin
America
Total
US$m US$m US$m US$m US$m US$m
At 31 December 2010
Financial assets ................................................... 36,233 26,278 1,651 2,548 9,168 75,878
– trading assets ............................................... –––– 11 11
– financial assets designated at fair value ...... 16,133 5,550 1,106 – 5,555 28,344
– derivatives ................................................... 238 50 12 – 1 301
– financial investments ................................... 16,758 17,299 247 2,006 2,722 39,032
– other financial assets ................................... 3,104 3,379 286 542 879 8,190
Reinsurance assets .............................................. 974 770 33 23 144 1,944
PVIF80 ................................................................. 1,102 1,734 165 141 298 3,440
Other assets and investment properties .............. 1,060 743 26 9 336 2,174
Total assets ......................................................... 39,369 29,525 1,875 2,721 9,946 83,436
Liabilities under investment contracts:
– designated at fair value ................................ 7,359 4,300 41 – – 11,700
– carried at amortised cost .............................. – – – – 439 439
Liabilities under insurance contracts .................. 27,475 21,515 1,381 1,169 7,069 58,609
Deferred tax ........................................................ 375 298 39 – 123 835
Other liabilities ................................................... 1,354 289 58 12 362 2,075
Total liabilities .................................................... 36,563 26,402 1,519 1,181 7,993 73,658
Total equity ......................................................... 2,806 3,123 356 1,540 1,953 9,778
Total equity and liabilities81 ............................... 39,369 29,525 1,875 2,721 9,946 83,436