HSBC 2010 Annual Report Download - page 173
Download and view the complete annual report
Please find page 173 of the 2010 HSBC annual report below. You can navigate through the pages in the report by either clicking on the pages listed below, or by using the keyword search tool below to find specific information within the annual report.-
 1
1 -
2
-
3
-
4
-
5
-
6
-
7
-
8
-
9
-
10
-
11
-
12
-
13
-
14
-
15
-
16
-
17
-
18
-
19
-
20
-
21
-
22
-
23
-
24
-
25
-
26
-
27
-
28
-
29
-
30
-
31
-
32
-
33
-
34
-
35
-
36
-
37
-
38
-
39
-
40
-
41
-
42
-
43
-
44
-
45
-
46
-
47
-
48
-
49
-
50
-
51
-
52
-
53
-
54
-
55
-
56
-
57
-
58
-
59
-
60
-
61
-
62
-
63
-
64
-
65
-
66
-
67
-
68
-
69
-
70
-
71
-
72
-
73
-
74
-
75
-
76
-
77
-
78
-
79
-
80
-
81
-
82
-
83
-
84
-
85
-
86
-
87
-
88
-
89
-
90
-
91
-
92
-
93
-
94
-
95
-
96
-
97
-
98
-
99
-
100
-
101
-
102
-
103
-
104
-
105
-
106
-
107
-
108
-
109
-
110
-
111
-
112
-
113
-
114
-
115
-
116
-
117
-
118
-
119
-
120
-
121
-
122
-
123
-
124
-
125
-
126
-
127
-
128
-
129
-
130
-
131
-
132
-
133
-
134
-
135
-
136
-
137
-
138
-
139
-
140
-
141
-
142
-
143
-
144
-
145
-
146
-
147
-
148
-
149
-
150
-
151
-
152
-
153
-
154
-
155
-
156
-
157
-
158
-
159
-
160
-
161
-
162
-
 163
163 -
 164
164 -
 165
165 -
 166
166 -
 167
167 -
 168
168 -
 169
169 -
 170
170 -
 171
171 -
 172
172 -
 173
173 -
 174
174 -
 175
175 -
 176
176 -
 177
177 -
 178
178 -
 179
179 -
 180
180 -
 181
181 -
 182
182 -
 183
183 -
184
-
185
-
186
-
187
-
188
-
189
-
190
-
191
-
192
-
193
-
194
-
195
-
196
-
197
-
198
-
199
-
200
-
201
-
202
-
203
-
204
-
205
-
206
-
207
-
208
-
209
-
210
-
211
-
212
-
213
-
214
-
215
-
216
-
217
-
218
-
219
-
220
-
221
-
222
-
223
-
224
-
225
-
226
-
227
-
228
-
229
-
230
-
231
-
232
-
233
-
234
-
235
-
236
-
237
-
238
-
239
-
240
-
241
-
242
-
243
-
244
-
245
-
246
-
247
-
248
-
249
-
250
-
251
-
252
-
253
-
254
-
255
-
256
-
257
-
258
-
259
-
260
-
261
-
262
-
263
-
264
-
265
-
266
-
267
-
268
-
269
-
270
-
271
-
272
-
273
-
274
-
275
-
276
-
277
-
278
-
279
-
280
-
281
-
282
-
283
-
284
-
285
-
286
-
287
-
288
-
289
-
290
-
291
-
292
-
293
-
294
-
295
-
296
-
297
-
298
-
299
-
300
-
301
-
302
-
303
-
304
-
305
-
306
-
307
-
308
-
309
-
310
-
311
-
312
-
313
-
314
-
315
-
316
-
317
-
318
-
319
-
320
-
321
-
322
-
323
-
324
-
325
-
326
-
327
-
328
-
329
-
330
-
331
-
332
-
333
-
334
-
335
-
336
-
337
-
338
-
339
-
340
-
341
-
342
-
343
-
344
-
345
-
346
-
347
-
348
-
349
-
350
-
351
-
352
-
353
-
354
-
355
-
356
-
357
-
358
-
359
-
360
-
361
-
362
-
363
-
364
-
365
-
366
-
367
-
368
-
369
-
370
-
371
-
372
-
373
-
374
-
375
-
376
-
377
-
378
-
379
-
380
-
381
-
382
-
383
-
384
-
385
-
386
-
387
-
388
-
389
-
390
-
391
-
392
-
393
-
394
-
395
-
396
 |
 |

171
Overview Operating & Financial Review Governance Financial Statements Shareholder Information
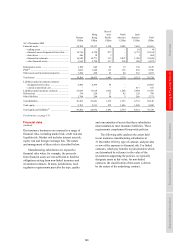
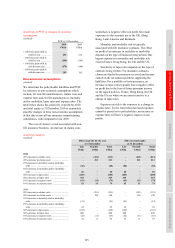
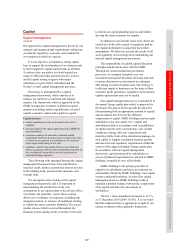
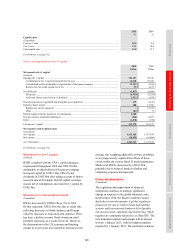
Sensitivity of PVIF to changes in economic
assumptions
(Audited)
PVIF at 31 December
2010 2009
US$m US$m
+ 100 basis point shift in
risk-free rate ................ 231 212
– 100 basis point shift in
risk-free rate ................ (190) (145)
+ 100 basis point shift in
risk discount rate ......... (179) (140)
– 100 basis point shift in
risk discount rate ......... 205 162
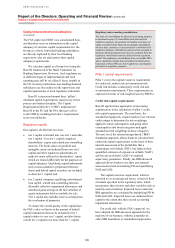
Non-economic assumptions
(Audited)
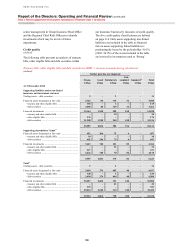
We determine the policyholder liabilities and PVIF
by reference to non-economic assumptions which
include, for non-life manufacturers, claims costs and
expense rates and, for life manufacturers, mortality
and/or morbidity, lapse rates and expense rates. The
table below shows the sensitivity of profit for 2010
and total equity at 31 December 2010 to reasonably
possible changes in these non-economic assumptions
at that date across all our insurance manufacturing
subsidiaries, with comparatives for 2009.
The cost of claims is a risk associated with non-
life insurance business. An increase in claims costs
would have a negative effect on profit. Our main
exposures to this scenario are in the UK, Hong
Kong, Latin America and Bermuda.
Mortality and morbidity risk is typically
associated with life insurance contracts. The effect
on profit of an increase in mortality or morbidity
depends on the type of business being written. Our
largest exposures to mortality and morbidity risk
exist in France, Hong Kong, the UK and the US.
Sensitivity to lapse rates depends on the type of
contracts being written. For insurance contracts,
claims are funded by premiums received and income
earned on the investment portfolio supporting the
liabilities. For a portfolio of term assurance, an
increase in lapse rates typically has a negative effect
on profit due to the loss of future premium income
on the lapsed policies. France, Hong Kong, the UK
and the US are where we are most sensitive to a
change in lapse rates.
Expense rate risk is the exposure to a change in
expense rates. To the extent that increased expenses
cannot be passed on to policyholders, an increase in
expense rates will have a negative impact on our
profits.
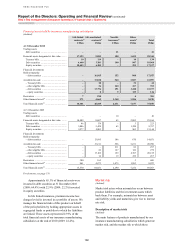
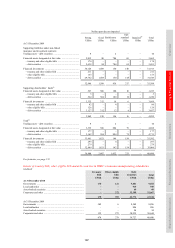
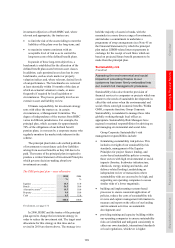
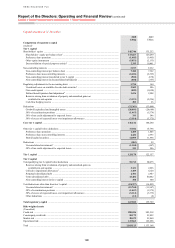
Sensitivity analysis
(Audited)
Effect on profit for the year
to 31 December
Effect on total equity
at 31 December
Life Non-life Total Life Non-life Total
US$m US$m US$m US$m US$m US$m
2010
20% increase in claims costs .............................. – (211) (211) – (211) (211)
20% decrease in claims costs ............................. – 211 211 – 211 211
10% increase in mortality and/or morbidity
rates ................................................................. (55) – (55) (55) – (55)
10% decrease in mortality and/or morbidity
rates ................................................................. 66 – 66 66 – 66
50% increase in lapse rates ................................. (203) – (203) (203) – (203)
50% decrease in lapse rates ................................ 363 – 363 363 – 363
10% increase in expense rates ............................ (63) (11) (74) (63) (11) (74)
10% decrease in expense rates ........................... 63 11 74 63 11 74
2009
20% increase in claims costs .............................. – (191) (191) – (191) (191)
20% decrease in claims costs ............................. – 190 190 – 190 190
10% increase in mortality and/or morbidity
rates ................................................................. (51) – (51) (51) – (51)
10% decrease in mortality and/or morbidity
rates ................................................................. 62 – 62 62 – 62
50% increase in lapse rates ................................. (162) – (162) (162) – (162)
50% decrease in lapse rates ................................ 408 – 408 408 – 408
10% increase in expense rates ............................ (52) (11) (63) (52) (11) (63)
10% decrease in expense rates ........................... 52 11 63 52 11 63