HSBC 2010 Annual Report Download - page 57
Download and view the complete annual report
Please find page 57 of the 2010 HSBC annual report below. You can navigate through the pages in the report by either clicking on the pages listed below, or by using the keyword search tool below to find specific information within the annual report.-
 1
1 -
2
-
3
-
4
-
5
-
6
-
7
-
8
-
9
-
10
-
11
-
12
-
13
-
14
-
15
-
16
-
17
-
18
-
19
-
20
-
21
-
22
-
23
-
24
-
25
-
26
-
27
-
28
-
29
-
30
-
31
-
32
-
33
-
34
-
35
-
36
-
37
-
38
-
39
-
40
-
41
-
42
-
43
-
44
-
45
-
46
-
 47
47 -
 48
48 -
 49
49 -
 50
50 -
 51
51 -
 52
52 -
 53
53 -
 54
54 -
 55
55 -
 56
56 -
 57
57 -
 58
58 -
 59
59 -
 60
60 -
 61
61 -
 62
62 -
 63
63 -
 64
64 -
 65
65 -
 66
66 -
 67
67 -
68
-
69
-
70
-
71
-
72
-
73
-
74
-
75
-
76
-
77
-
78
-
79
-
80
-
81
-
82
-
83
-
84
-
85
-
86
-
87
-
88
-
89
-
90
-
91
-
92
-
93
-
94
-
95
-
96
-
97
-
98
-
99
-
100
-
101
-
102
-
103
-
104
-
105
-
106
-
107
-
108
-
109
-
110
-
111
-
112
-
113
-
114
-
115
-
116
-
117
-
118
-
119
-
120
-
121
-
122
-
123
-
124
-
125
-
126
-
127
-
128
-
129
-
130
-
131
-
132
-
133
-
134
-
135
-
136
-
137
-
138
-
139
-
140
-
141
-
142
-
143
-
144
-
145
-
146
-
147
-
148
-
149
-
150
-
151
-
152
-
153
-
154
-
155
-
156
-
157
-
158
-
159
-
160
-
161
-
162
-
163
-
164
-
165
-
166
-
167
-
168
-
169
-
170
-
171
-
172
-
173
-
174
-
175
-
176
-
177
-
178
-
179
-
180
-
181
-
182
-
183
-
184
-
185
-
186
-
187
-
188
-
189
-
190
-
191
-
192
-
193
-
194
-
195
-
196
-
197
-
198
-
199
-
200
-
201
-
202
-
203
-
204
-
205
-
206
-
207
-
208
-
209
-
210
-
211
-
212
-
213
-
214
-
215
-
216
-
217
-
218
-
219
-
220
-
221
-
222
-
223
-
224
-
225
-
226
-
227
-
228
-
229
-
230
-
231
-
232
-
233
-
234
-
235
-
236
-
237
-
238
-
239
-
240
-
241
-
242
-
243
-
244
-
245
-
246
-
247
-
248
-
249
-
250
-
251
-
252
-
253
-
254
-
255
-
256
-
257
-
258
-
259
-
260
-
261
-
262
-
263
-
264
-
265
-
266
-
267
-
268
-
269
-
270
-
271
-
272
-
273
-
274
-
275
-
276
-
277
-
278
-
279
-
280
-
281
-
282
-
283
-
284
-
285
-
286
-
287
-
288
-
289
-
290
-
291
-
292
-
293
-
294
-
295
-
296
-
297
-
298
-
299
-
300
-
301
-
302
-
303
-
304
-
305
-
306
-
307
-
308
-
309
-
310
-
311
-
312
-
313
-
314
-
315
-
316
-
317
-
318
-
319
-
320
-
321
-
322
-
323
-
324
-
325
-
326
-
327
-
328
-
329
-
330
-
331
-
332
-
333
-
334
-
335
-
336
-
337
-
338
-
339
-
340
-
341
-
342
-
343
-
344
-
345
-
346
-
347
-
348
-
349
-
350
-
351
-
352
-
353
-
354
-
355
-
356
-
357
-
358
-
359
-
360
-
361
-
362
-
363
-
364
-
365
-
366
-
367
-
368
-
369
-
370
-
371
-
372
-
373
-
374
-
375
-
376
-
377
-
378
-
379
-
380
-
381
-
382
-
383
-
384
-
385
-
386
-
387
-
388
-
389
-
390
-
391
-
392
-
393
-
394
-
395
-
396
 |
 |

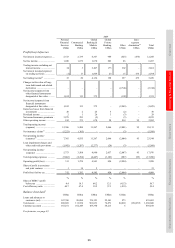
55
Overview Operating & Financial Review Governance Financial Statements Shareholder Information
2009
Personal
Financial
Services
US$m
Commercial
Banking
US$m
Global
Banking &
Markets
US$m
Global
Private
Banking
US$m
Other
US$m
Inter-
segment
elimination56
US$m
Total
US$m
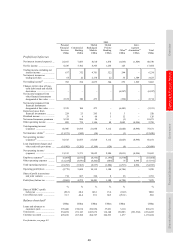
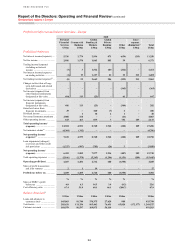
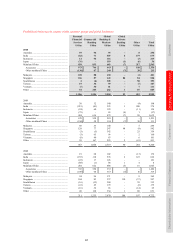
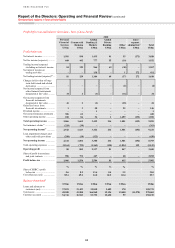
Profit/(loss) before tax
Net interest income/(expense) .... 5,413 2,739 4,367 949 (525) (675) 12,268
Net fee income ............................ 1,949 1,679 1,670 883 86 – 6,267
Trading income excluding net
interest income ....................... 34 3 2,267 175 382 – 2,861
Net interest income/(expense)
on trading activities ................ (1) 17 1,869 23 15 675 2,598
Net trading income49 ................... 33 20 4,136 198 397 675 5,459
Changes in fair value of long-
term debt issued and related
derivatives .............................. – – – – (2,746) – (2,746)
Net income/(expense) from
other financial instruments
designated at fair value ........... 1,012 133 375 – (199) – 1,321
Net income/(expense) from
financial instruments
designated at fair value ........... 1,012 133 375 – (2,945) – (1,425)
Gains less losses from financial
investments ............................. 20 2 25 5 (2) – 50
Dividend income ......................... 2 1 26 3 (3) – 29
Net earned insurance premiums . 3,975 253 (2) – (3) – 4,223
Other operating income .............. 182 373 670 28 914 95 2,262
Total operating income/
(expense) ................................ 12,586 5,200 11,267 2,066 (2,081) 95 29,133
Net insurance claims57 ................ (5,221) (365) – – (3) – (5,589)
Net operating income/
(expense)46 .............................. 7,365 4,835 11,267 2,066 (2,084) 95 23,544
Loan impairment charges and
other credit risk provisions ..... (1,992) (1,267) (2,277) (29) (3) – (5,568)
Net operating income/
(expense) ................................ 5,373 3,568 8,990 2,037 (2,087) 95 17,976
Total operating expenses ............ (5,062) (2,294) (4,447) (1,183) (907) (95) (13,988)
Operating profit/(loss) ................ 311 1,274 4,543 854 (2,994) – 3,988
Share of profit in associates
and joint ventures ................... 1 18 2 – – – 21
Profit/(loss) before tax ................ 312 1,292 4,545 854 (2,994) – 4,009
% % % % % %
Share of HSBC’s profit
before tax ................................ 4.4 18.3 64.2 12.1 (42.3) 56.7
Cost efficiency ratio ................... 68.7 47.4 39.5 57.3 (43.5) 59.4
Balance sheet data45
US$m US$m US$m US$m US$m US$m
Loans and advances to
customers (net) ....................... 147,760 89,084 176,123 25,541 973 439,481
Total assets ................................. 208,669 111,874 981,831 76,871 84,010 (194,655) 1,268,600
Customer accounts ...................... 165,161 102,249 169,390 58,213 6 495,019
For footnotes, see page 83.