HSBC 2010 Annual Report Download - page 291
Download and view the complete annual report
Please find page 291 of the 2010 HSBC annual report below. You can navigate through the pages in the report by either clicking on the pages listed below, or by using the keyword search tool below to find specific information within the annual report.-
 1
1 -
2
-
3
-
4
-
5
-
6
-
7
-
8
-
9
-
10
-
11
-
12
-
13
-
14
-
15
-
16
-
17
-
18
-
19
-
20
-
21
-
22
-
23
-
24
-
25
-
26
-
27
-
28
-
29
-
30
-
31
-
32
-
33
-
34
-
35
-
36
-
37
-
38
-
39
-
40
-
41
-
42
-
43
-
44
-
45
-
46
-
47
-
48
-
49
-
50
-
51
-
52
-
53
-
54
-
55
-
56
-
57
-
58
-
59
-
60
-
61
-
62
-
63
-
64
-
65
-
66
-
67
-
68
-
69
-
70
-
71
-
72
-
73
-
74
-
75
-
76
-
77
-
78
-
79
-
80
-
81
-
82
-
83
-
84
-
85
-
86
-
87
-
88
-
89
-
90
-
91
-
92
-
93
-
94
-
95
-
96
-
97
-
98
-
99
-
100
-
101
-
102
-
103
-
104
-
105
-
106
-
107
-
108
-
109
-
110
-
111
-
112
-
113
-
114
-
115
-
116
-
117
-
118
-
119
-
120
-
121
-
122
-
123
-
124
-
125
-
126
-
127
-
128
-
129
-
130
-
131
-
132
-
133
-
134
-
135
-
136
-
137
-
138
-
139
-
140
-
141
-
142
-
143
-
144
-
145
-
146
-
147
-
148
-
149
-
150
-
151
-
152
-
153
-
154
-
155
-
156
-
157
-
158
-
159
-
160
-
161
-
162
-
163
-
164
-
165
-
166
-
167
-
168
-
169
-
170
-
171
-
172
-
173
-
174
-
175
-
176
-
177
-
178
-
179
-
180
-
181
-
182
-
183
-
184
-
185
-
186
-
187
-
188
-
189
-
190
-
191
-
192
-
193
-
194
-
195
-
196
-
197
-
198
-
199
-
200
-
201
-
202
-
203
-
204
-
205
-
206
-
207
-
208
-
209
-
210
-
211
-
212
-
213
-
214
-
215
-
216
-
217
-
218
-
219
-
220
-
221
-
222
-
223
-
224
-
225
-
226
-
227
-
228
-
229
-
230
-
231
-
232
-
233
-
234
-
235
-
236
-
237
-
238
-
239
-
240
-
241
-
242
-
243
-
244
-
245
-
246
-
247
-
248
-
249
-
250
-
251
-
252
-
253
-
254
-
255
-
256
-
257
-
258
-
259
-
260
-
261
-
262
-
263
-
264
-
265
-
266
-
267
-
268
-
269
-
270
-
271
-
272
-
273
-
274
-
275
-
276
-
277
-
278
-
279
-
280
-
 281
281 -
 282
282 -
 283
283 -
 284
284 -
 285
285 -
 286
286 -
 287
287 -
 288
288 -
 289
289 -
 290
290 -
 291
291 -
 292
292 -
 293
293 -
 294
294 -
 295
295 -
 296
296 -
 297
297 -
 298
298 -
 299
299 -
 300
300 -
 301
301 -
302
-
303
-
304
-
305
-
306
-
307
-
308
-
309
-
310
-
311
-
312
-
313
-
314
-
315
-
316
-
317
-
318
-
319
-
320
-
321
-
322
-
323
-
324
-
325
-
326
-
327
-
328
-
329
-
330
-
331
-
332
-
333
-
334
-
335
-
336
-
337
-
338
-
339
-
340
-
341
-
342
-
343
-
344
-
345
-
346
-
347
-
348
-
349
-
350
-
351
-
352
-
353
-
354
-
355
-
356
-
357
-
358
-
359
-
360
-
361
-
362
-
363
-
364
-
365
-
366
-
367
-
368
-
369
-
370
-
371
-
372
-
373
-
374
-
375
-
376
-
377
-
378
-
379
-
380
-
381
-
382
-
383
-
384
-
385
-
386
-
387
-
388
-
389
-
390
-
391
-
392
-
393
-
394
-
395
-
396
 |
 |

289
Overview Operating & Financial Review Governance Financial Statements Shareholder Information
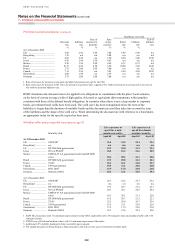
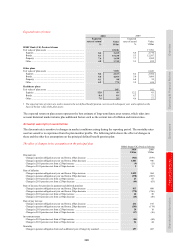
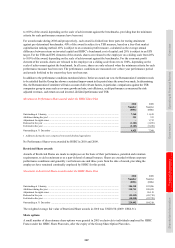
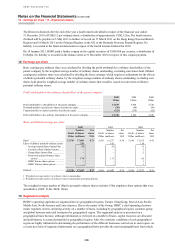
The weighted average fair value of options granted during the year was US$2.41 (2009: US$2.03). The weighted
average share price at the date the share options were exercised was US$10.08 (2009: US$10.23). The exercise price
range and weighted average remaining contractual life for options outstanding at the balance sheet date were as
follows:
2010 2009
Exercise price range (£) ............................................................................................................................ 3.31 – 6.69 3.31 – 6.69
Weighted average remaining contractual life (years) .............................................................................. 2.76 3.47
Of which exercisable:
Number (000s) ...................................................................................................................................... 1,883 5,145
Weighted average exercise price (£) .................................................................................................... 6.23 6.26
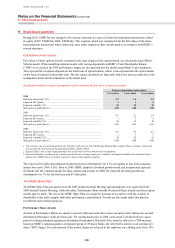
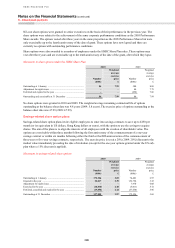
HSBC Holdings Restricted Share Plan 2000
Restricted Share awards made under the Restricted Share Plan
Awards of Restricted Shares were made under the Restricted Share Plan to eligible employees from 2000 to 2005,
after taking into account the employees’ performance in the previous year, their potential and retention requirements.
Restricted shares were also awarded as part-deferral of annual bonuses or for recruitment purposes. Shares were
awarded without corporate performance conditions and in most cases fully vest within three years from the date of
award, providing the employees have remained continuously employed by HSBC for the period.
Movement on Restricted Share awards under the HSBC Holdings Restricted Share Plan
2010
Number
2009
Number
(000s) (000s)
Outstanding at 1 January .......................................................................................................................... 173 2,717
Additions during the year1 ........................................................................................................................ – 30
Adjustment for rights issue ....................................................................................................................... – 376
Released in the year .................................................................................................................................. – (2,916)
Forfeited in the year .................................................................................................................................. (173) (34)
Outstanding at 31 December .................................................................................................................... – 173
1 Additions in 2009 principally comprised reinvested dividend equivalents.
At 31 December 2009 the weighted average remaining vesting period was 0.3 years.
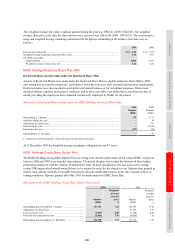
HSBC Holdings Group Share Option Plan
The HSBC Holdings Group Share Option Plan was a long-term incentive plan under which certain HSBC employees
between 2000 and 2005 were awarded share options. The aim of the plan was to align the interests of those higher
performing employees with the creation of shareholder value. In most jurisdictions, this was achieved by setting
certain TSR targets which would normally have to be attained in order for the awards to vest. Options were granted at
market value and are normally exercisable between the third and tenth anniversaries of the date of grant, subject to
vesting conditions. Options granted after May 2005 are made under the HSBC Share Plan.
Movement on the HSBC Holdings Group Share Option Plan awards
2010 2009
Number
Weighted
average
exercise
price Number
Weighted
average
exercise
price
(000s) £ (000s) £
Outstanding and exercisable at 1 January .................................... 157,719 7.12 142,593 8.16
Adjustment for rights issue ........................................................... – – 21,333 7.12
Exercised in the year ..................................................................... (1,015) 6.08 (1,548) 6.28
Forfeited and expired in the year .................................................. (3,946) 7.36 (4,659) 7.15
Outstanding and exercisable at 31 December .............................. 152,758 7.12 157,719 7.12