HSBC 2010 Annual Report Download - page 276
Download and view the complete annual report
Please find page 276 of the 2010 HSBC annual report below. You can navigate through the pages in the report by either clicking on the pages listed below, or by using the keyword search tool below to find specific information within the annual report.-
 1
1 -
2
-
3
-
4
-
5
-
6
-
7
-
8
-
9
-
10
-
11
-
12
-
13
-
14
-
15
-
16
-
17
-
18
-
19
-
20
-
21
-
22
-
23
-
24
-
25
-
26
-
27
-
28
-
29
-
30
-
31
-
32
-
33
-
34
-
35
-
36
-
37
-
38
-
39
-
40
-
41
-
42
-
43
-
44
-
45
-
46
-
47
-
48
-
49
-
50
-
51
-
52
-
53
-
54
-
55
-
56
-
57
-
58
-
59
-
60
-
61
-
62
-
63
-
64
-
65
-
66
-
67
-
68
-
69
-
70
-
71
-
72
-
73
-
74
-
75
-
76
-
77
-
78
-
79
-
80
-
81
-
82
-
83
-
84
-
85
-
86
-
87
-
88
-
89
-
90
-
91
-
92
-
93
-
94
-
95
-
96
-
97
-
98
-
99
-
100
-
101
-
102
-
103
-
104
-
105
-
106
-
107
-
108
-
109
-
110
-
111
-
112
-
113
-
114
-
115
-
116
-
117
-
118
-
119
-
120
-
121
-
122
-
123
-
124
-
125
-
126
-
127
-
128
-
129
-
130
-
131
-
132
-
133
-
134
-
135
-
136
-
137
-
138
-
139
-
140
-
141
-
142
-
143
-
144
-
145
-
146
-
147
-
148
-
149
-
150
-
151
-
152
-
153
-
154
-
155
-
156
-
157
-
158
-
159
-
160
-
161
-
162
-
163
-
164
-
165
-
166
-
167
-
168
-
169
-
170
-
171
-
172
-
173
-
174
-
175
-
176
-
177
-
178
-
179
-
180
-
181
-
182
-
183
-
184
-
185
-
186
-
187
-
188
-
189
-
190
-
191
-
192
-
193
-
194
-
195
-
196
-
197
-
198
-
199
-
200
-
201
-
202
-
203
-
204
-
205
-
206
-
207
-
208
-
209
-
210
-
211
-
212
-
213
-
214
-
215
-
216
-
217
-
218
-
219
-
220
-
221
-
222
-
223
-
224
-
225
-
226
-
227
-
228
-
229
-
230
-
231
-
232
-
233
-
234
-
235
-
236
-
237
-
238
-
239
-
240
-
241
-
242
-
243
-
244
-
245
-
246
-
247
-
248
-
249
-
250
-
251
-
252
-
253
-
254
-
255
-
256
-
257
-
258
-
259
-
260
-
261
-
262
-
263
-
264
-
265
-
 266
266 -
 267
267 -
 268
268 -
 269
269 -
 270
270 -
 271
271 -
 272
272 -
 273
273 -
 274
274 -
 275
275 -
 276
276 -
 277
277 -
 278
278 -
 279
279 -
 280
280 -
 281
281 -
 282
282 -
 283
283 -
 284
284 -
 285
285 -
 286
286 -
287
-
288
-
289
-
290
-
291
-
292
-
293
-
294
-
295
-
296
-
297
-
298
-
299
-
300
-
301
-
302
-
303
-
304
-
305
-
306
-
307
-
308
-
309
-
310
-
311
-
312
-
313
-
314
-
315
-
316
-
317
-
318
-
319
-
320
-
321
-
322
-
323
-
324
-
325
-
326
-
327
-
328
-
329
-
330
-
331
-
332
-
333
-
334
-
335
-
336
-
337
-
338
-
339
-
340
-
341
-
342
-
343
-
344
-
345
-
346
-
347
-
348
-
349
-
350
-
351
-
352
-
353
-
354
-
355
-
356
-
357
-
358
-
359
-
360
-
361
-
362
-
363
-
364
-
365
-
366
-
367
-
368
-
369
-
370
-
371
-
372
-
373
-
374
-
375
-
376
-
377
-
378
-
379
-
380
-
381
-
382
-
383
-
384
-
385
-
386
-
387
-
388
-
389
-
390
-
391
-
392
-
393
-
394
-
395
-
396
 |
 |
HSBC HOLDINGS PLC
Notes on the Financial Statements (continued)
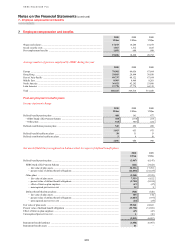
7 – Employee compensation and benefits
274
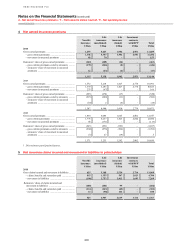
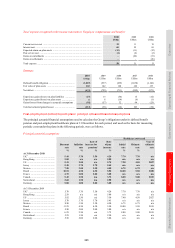
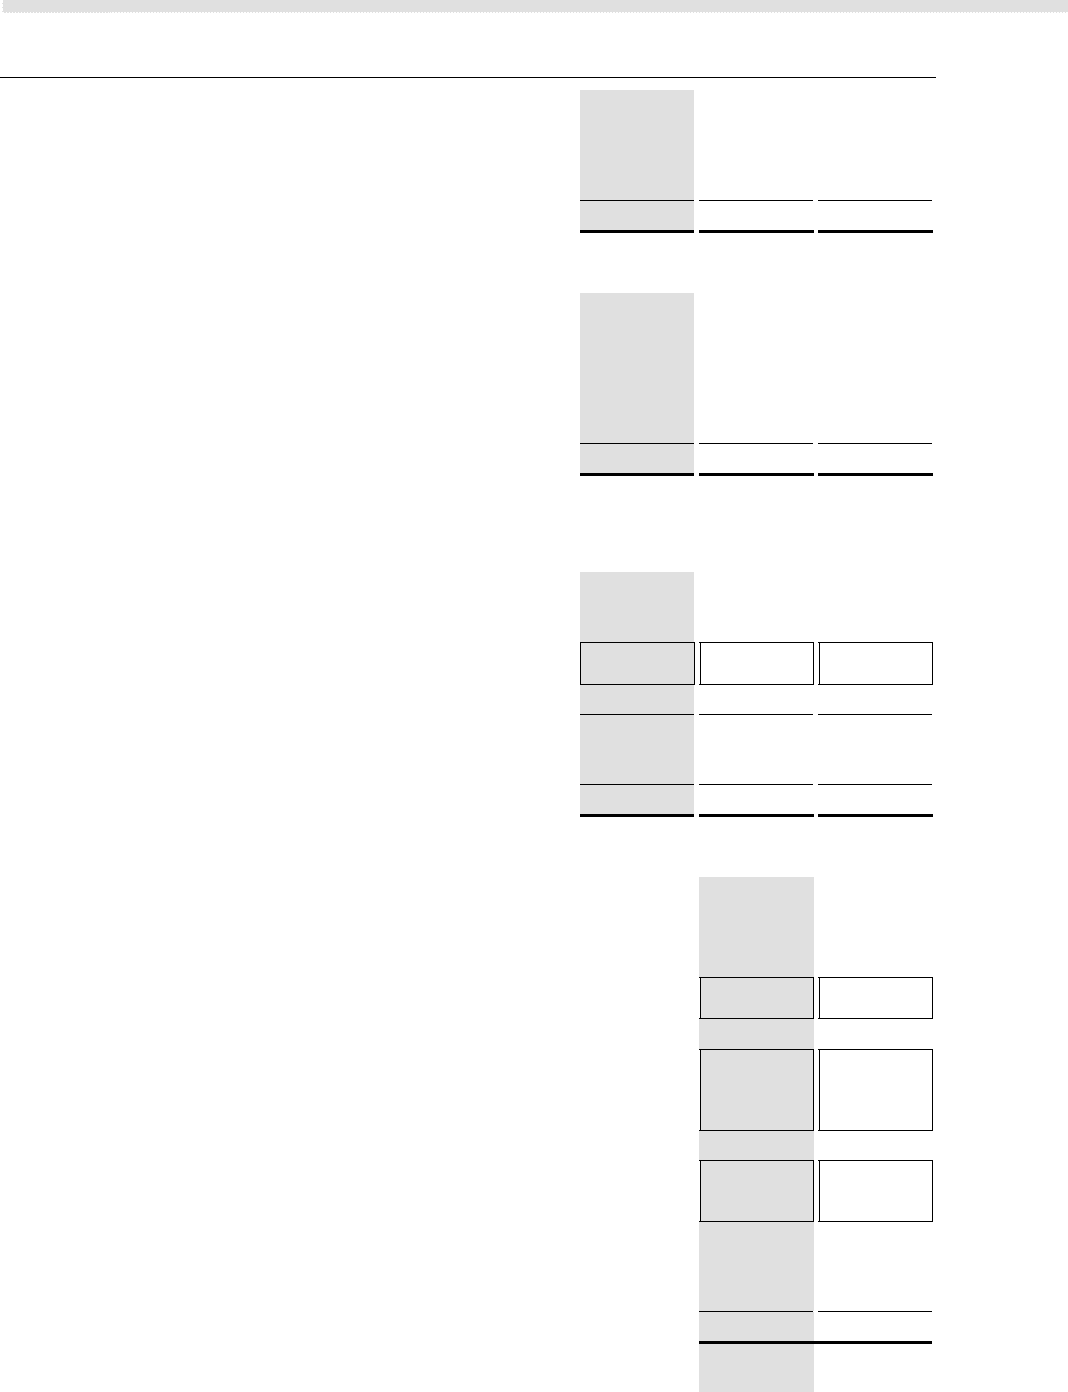
7 Employee compensation and benefits
2010 2009 2008
US$m US$m US$m
Wages and salaries ...................................................................................................... 17,193 16,268 18,169
Social security costs .................................................................................................... 1,567 1,512 1,625
Post-employment benefits .......................................................................................... 1,076 688 998
19,836 18,468 20,792
Average number of persons employed by HSBC during the year
2010 2009 2008
Europe ......................................................................................................................... 79,902 84,056 87,864
Hong Kong ................................................................................................................. 29,105 28,894 30,030
Rest of Asia-Pacific .................................................................................................... 89,737 88,122 87,954
Middle East ................................................................................................................. 8,983 8,468 8,201
North America ............................................................................................................ 36,822 42,202 53,090
Latin America ............................................................................................................. 57,778 57,774 64,319
Total ............................................................................................................................ 302,327 309,516 331,458
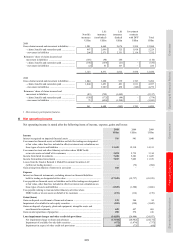
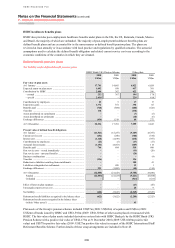
Post-employment benefit plans
Income statement charge
2010 2009 2008
US$m US$m US$m
Defined benefit pension plans .................................................................................... 468 161 477
– HSBC Bank (UK) Pension Scheme .................................................................... 308 (179) 255
– Other plans .......................................................................................................... 160 340 222
Defined contribution pension plans ........................................................................... 545 492 498
1,013 653 975
Defined benefit healthcare plans ................................................................................ 58 31 13
Defined contribution healthcare plans ........................................................................ 5 4 10
1,076 688 998
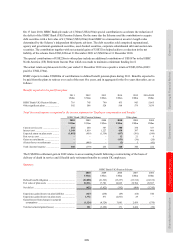
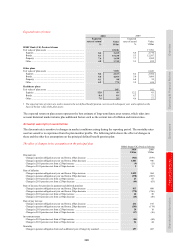
Net assets/(liabilities) recognised on balance sheet in respect of defined benefit plans
2010 2009
US$m US$m
Defined benefit pension plans .................................................................................................................. (2,867) (6,147)
HSBC Bank (UK) Pension Scheme ..................................................................................................... (622) (3,822)
– fair value of plan assets ................................................................................................................ 22,236 17,701
– present value of defined benefit obligations ................................................................................ (22,858) (21,523)
Other plans ........................................................................................................................................... (2,245) (2,325)
– fair value of plan assets ................................................................................................................ 7,559 6,822
– present value of defined benefit obligations ................................................................................ (9,785) (9,109)
– effect of limit on plan surpluses ................................................................................................... (47) (47)
– unrecognised past service cost ..................................................................................................... 28 9
Defined benefit healthcare plans .......................................................................................................... (946) (820)
– fair value of plan assets ................................................................................................................ 165 142
– present value of defined benefit obligations ................................................................................ (1,087) (937)
– unrecognised past service cost ..................................................................................................... (24) (25)
Fair value of plan assets ........................................................................................................................... 29,960 24,665
Present value of defined benefit obligations ............................................................................................ (33,730) (31,569)
Effect of limit on plan surpluses ............................................................................................................... (47) (47)
Unrecognised past service cost ................................................................................................................. 4 (16)
(3,813) (6,967)
Retirement benefit liabilities .................................................................................................................... (3,856) (6,967)
Retirement benefit assets .......................................................................................................................... 43 –