HSBC 2010 Annual Report Download - page 120
Download and view the complete annual report
Please find page 120 of the 2010 HSBC annual report below. You can navigate through the pages in the report by either clicking on the pages listed below, or by using the keyword search tool below to find specific information within the annual report.-
 1
1 -
2
-
3
-
4
-
5
-
6
-
7
-
8
-
9
-
10
-
11
-
12
-
13
-
14
-
15
-
16
-
17
-
18
-
19
-
20
-
21
-
22
-
23
-
24
-
25
-
26
-
27
-
28
-
29
-
30
-
31
-
32
-
33
-
34
-
35
-
36
-
37
-
38
-
39
-
40
-
41
-
42
-
43
-
44
-
45
-
46
-
47
-
48
-
49
-
50
-
51
-
52
-
53
-
54
-
55
-
56
-
57
-
58
-
59
-
60
-
61
-
62
-
63
-
64
-
65
-
66
-
67
-
68
-
69
-
70
-
71
-
72
-
73
-
74
-
75
-
76
-
77
-
78
-
79
-
80
-
81
-
82
-
83
-
84
-
85
-
86
-
87
-
88
-
89
-
90
-
91
-
92
-
93
-
94
-
95
-
96
-
97
-
98
-
99
-
100
-
101
-
102
-
103
-
104
-
105
-
106
-
107
-
108
-
109
-
 110
110 -
 111
111 -
 112
112 -
 113
113 -
 114
114 -
 115
115 -
 116
116 -
 117
117 -
 118
118 -
 119
119 -
 120
120 -
 121
121 -
 122
122 -
 123
123 -
 124
124 -
 125
125 -
 126
126 -
 127
127 -
 128
128 -
 129
129 -
 130
130 -
131
-
132
-
133
-
134
-
135
-
136
-
137
-
138
-
139
-
140
-
141
-
142
-
143
-
144
-
145
-
146
-
147
-
148
-
149
-
150
-
151
-
152
-
153
-
154
-
155
-
156
-
157
-
158
-
159
-
160
-
161
-
162
-
163
-
164
-
165
-
166
-
167
-
168
-
169
-
170
-
171
-
172
-
173
-
174
-
175
-
176
-
177
-
178
-
179
-
180
-
181
-
182
-
183
-
184
-
185
-
186
-
187
-
188
-
189
-
190
-
191
-
192
-
193
-
194
-
195
-
196
-
197
-
198
-
199
-
200
-
201
-
202
-
203
-
204
-
205
-
206
-
207
-
208
-
209
-
210
-
211
-
212
-
213
-
214
-
215
-
216
-
217
-
218
-
219
-
220
-
221
-
222
-
223
-
224
-
225
-
226
-
227
-
228
-
229
-
230
-
231
-
232
-
233
-
234
-
235
-
236
-
237
-
238
-
239
-
240
-
241
-
242
-
243
-
244
-
245
-
246
-
247
-
248
-
249
-
250
-
251
-
252
-
253
-
254
-
255
-
256
-
257
-
258
-
259
-
260
-
261
-
262
-
263
-
264
-
265
-
266
-
267
-
268
-
269
-
270
-
271
-
272
-
273
-
274
-
275
-
276
-
277
-
278
-
279
-
280
-
281
-
282
-
283
-
284
-
285
-
286
-
287
-
288
-
289
-
290
-
291
-
292
-
293
-
294
-
295
-
296
-
297
-
298
-
299
-
300
-
301
-
302
-
303
-
304
-
305
-
306
-
307
-
308
-
309
-
310
-
311
-
312
-
313
-
314
-
315
-
316
-
317
-
318
-
319
-
320
-
321
-
322
-
323
-
324
-
325
-
326
-
327
-
328
-
329
-
330
-
331
-
332
-
333
-
334
-
335
-
336
-
337
-
338
-
339
-
340
-
341
-
342
-
343
-
344
-
345
-
346
-
347
-
348
-
349
-
350
-
351
-
352
-
353
-
354
-
355
-
356
-
357
-
358
-
359
-
360
-
361
-
362
-
363
-
364
-
365
-
366
-
367
-
368
-
369
-
370
-
371
-
372
-
373
-
374
-
375
-
376
-
377
-
378
-
379
-
380
-
381
-
382
-
383
-
384
-
385
-
386
-
387
-
388
-
389
-
390
-
391
-
392
-
393
-
394
-
395
-
396
 |
 |
HSBC HOLDINGS PLC
Report of the Directors: Operating and Financial Review (continued)
Risk > Credit risk > Credit quality > Past due but not impaired / Impaired loans / Impairment allowances
118
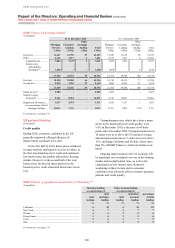
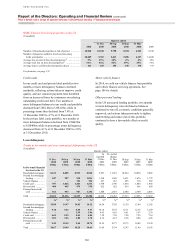
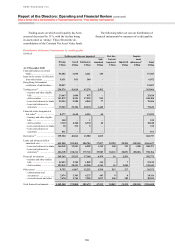
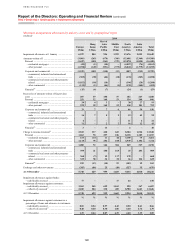
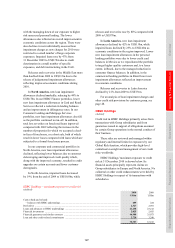
Past due but not impaired loans and advances to customers and banks by industry sector
(Audited)
At 31 December
2010 2009
US$m US$m
Banks ........................................................................................................................................................ 108 12
Customers ................................................................................................................................................. 30,212 40,066
Personal ................................................................................................................................................ 24,824 34,306
Corporate and commercial ................................................................................................................... 5,292 5,522
Financial ............................................................................................................................................... 96 238
30,320 40,078
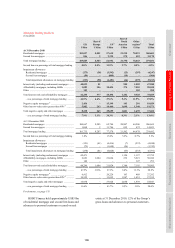
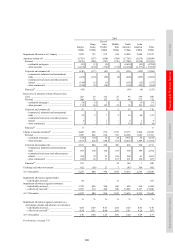
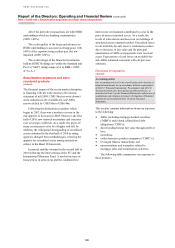
Ageing analysis of days past due but not impaired gross financial instruments
(Audited)
Up to 29
days
30-59
days
60-89
days
90-179
days
180 days
and over Total
US$m US$m US$m US$m US$m US$m
At 31 December 2010
Loans and advances held at amortised cost .......................... 19,481 6,915 3,281 482 161 30,320
– loans and advances to banks ......................................... 108 ––– – 108
– loans and advances to customers .................................. 19,373 6,915 3,281 482 161 30,212
Financial investments
– debt securities ................................................................ 16 – – – – 16
Other assets ........................................................................... 262 123 57 26 45 513
– endorsements and acceptances ...................................... 7 ––1 1 9
– other ............................................................................... 255 123 57 25 44 504
19,759 7,038 3,338 508 206 30,849
At 31 December 2009
Loans and advances held at amortised cost .......................... 24,330 9,920 5,259 355 214 40,078
– loans and advances to banks ......................................... 12 – – – – 12
– loans and advances to customers .................................. 24,318 9,920 5,259 355 214 40,066
Other assets ........................................................................... 609 130 63 24 82 908
– endorsements and acceptances ...................................... 9 1 – 1 1 12
– other ............................................................................... 600 129 63 23 81 896
24,939 10,050 5,322 379 296 40,986
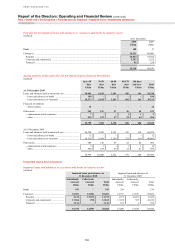
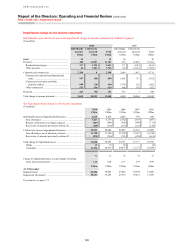
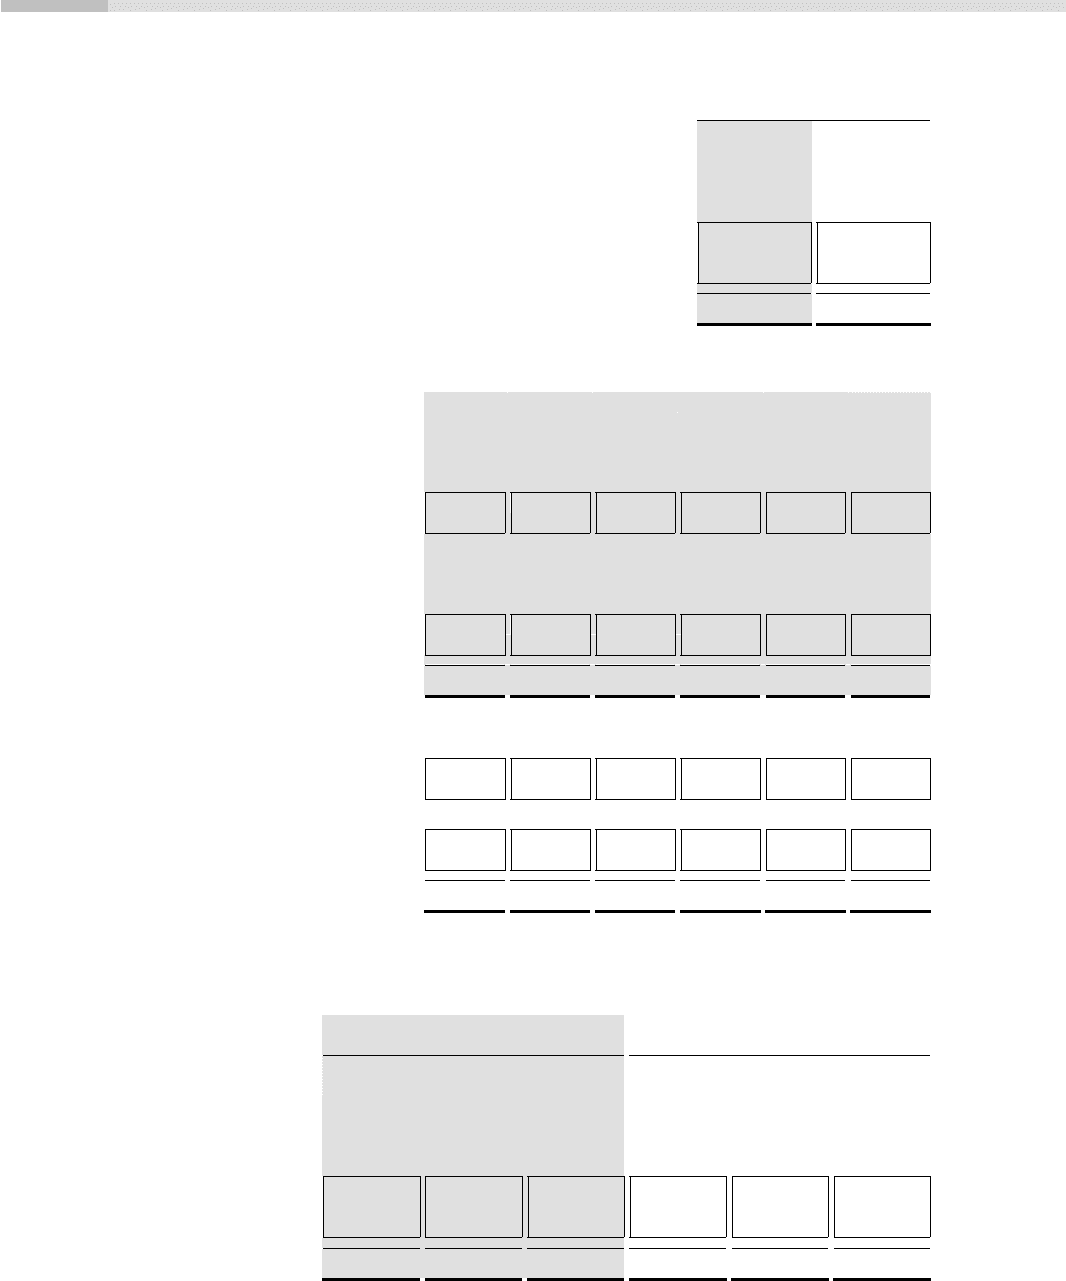
Impaired loans and advances
Impaired loans and advances to customers and banks by industry sector
(Audited)
Impaired loans and advances at
31 December 2010
Impaired loans and advances at
31 December 2009
Individually
assessed
Collectively
assessed Total
Individually
assessed
Collectively
assessed
Total
US$m US$m US$m US$m US$m US$m
Banks .......................................................... 193 – 193 239 – 239
Customers ................................................... 15,201 12,890 28,091 14,767 15,839 30,606
Personal .................................................. 2,121 12,592 14,713 1,977 15,451 17,428
Corporate and commercial ..................... 11,964 298 12,262 11,839 387 12,226
Financial ................................................. 1,116 –1,116 951 1 952
15,394 12,890 28,284 15,006 15,839 30,845