HSBC 2010 Annual Report Download - page 165
Download and view the complete annual report
Please find page 165 of the 2010 HSBC annual report below. You can navigate through the pages in the report by either clicking on the pages listed below, or by using the keyword search tool below to find specific information within the annual report.-
 1
1 -
2
-
3
-
4
-
5
-
6
-
7
-
8
-
9
-
10
-
11
-
12
-
13
-
14
-
15
-
16
-
17
-
18
-
19
-
20
-
21
-
22
-
23
-
24
-
25
-
26
-
27
-
28
-
29
-
30
-
31
-
32
-
33
-
34
-
35
-
36
-
37
-
38
-
39
-
40
-
41
-
42
-
43
-
44
-
45
-
46
-
47
-
48
-
49
-
50
-
51
-
52
-
53
-
54
-
55
-
56
-
57
-
58
-
59
-
60
-
61
-
62
-
63
-
64
-
65
-
66
-
67
-
68
-
69
-
70
-
71
-
72
-
73
-
74
-
75
-
76
-
77
-
78
-
79
-
80
-
81
-
82
-
83
-
84
-
85
-
86
-
87
-
88
-
89
-
90
-
91
-
92
-
93
-
94
-
95
-
96
-
97
-
98
-
99
-
100
-
101
-
102
-
103
-
104
-
105
-
106
-
107
-
108
-
109
-
110
-
111
-
112
-
113
-
114
-
115
-
116
-
117
-
118
-
119
-
120
-
121
-
122
-
123
-
124
-
125
-
126
-
127
-
128
-
129
-
130
-
131
-
132
-
133
-
134
-
135
-
136
-
137
-
138
-
139
-
140
-
141
-
142
-
143
-
144
-
145
-
146
-
147
-
148
-
149
-
150
-
151
-
152
-
153
-
154
-
 155
155 -
 156
156 -
 157
157 -
 158
158 -
 159
159 -
 160
160 -
 161
161 -
 162
162 -
 163
163 -
 164
164 -
 165
165 -
 166
166 -
 167
167 -
 168
168 -
 169
169 -
 170
170 -
 171
171 -
 172
172 -
 173
173 -
 174
174 -
 175
175 -
176
-
177
-
178
-
179
-
180
-
181
-
182
-
183
-
184
-
185
-
186
-
187
-
188
-
189
-
190
-
191
-
192
-
193
-
194
-
195
-
196
-
197
-
198
-
199
-
200
-
201
-
202
-
203
-
204
-
205
-
206
-
207
-
208
-
209
-
210
-
211
-
212
-
213
-
214
-
215
-
216
-
217
-
218
-
219
-
220
-
221
-
222
-
223
-
224
-
225
-
226
-
227
-
228
-
229
-
230
-
231
-
232
-
233
-
234
-
235
-
236
-
237
-
238
-
239
-
240
-
241
-
242
-
243
-
244
-
245
-
246
-
247
-
248
-
249
-
250
-
251
-
252
-
253
-
254
-
255
-
256
-
257
-
258
-
259
-
260
-
261
-
262
-
263
-
264
-
265
-
266
-
267
-
268
-
269
-
270
-
271
-
272
-
273
-
274
-
275
-
276
-
277
-
278
-
279
-
280
-
281
-
282
-
283
-
284
-
285
-
286
-
287
-
288
-
289
-
290
-
291
-
292
-
293
-
294
-
295
-
296
-
297
-
298
-
299
-
300
-
301
-
302
-
303
-
304
-
305
-
306
-
307
-
308
-
309
-
310
-
311
-
312
-
313
-
314
-
315
-
316
-
317
-
318
-
319
-
320
-
321
-
322
-
323
-
324
-
325
-
326
-
327
-
328
-
329
-
330
-
331
-
332
-
333
-
334
-
335
-
336
-
337
-
338
-
339
-
340
-
341
-
342
-
343
-
344
-
345
-
346
-
347
-
348
-
349
-
350
-
351
-
352
-
353
-
354
-
355
-
356
-
357
-
358
-
359
-
360
-
361
-
362
-
363
-
364
-
365
-
366
-
367
-
368
-
369
-
370
-
371
-
372
-
373
-
374
-
375
-
376
-
377
-
378
-
379
-
380
-
381
-
382
-
383
-
384
-
385
-
386
-
387
-
388
-
389
-
390
-
391
-
392
-
393
-
394
-
395
-
396
 |
 |

163
Overview Operating & Financial Review Governance Financial Statements Shareholder Information
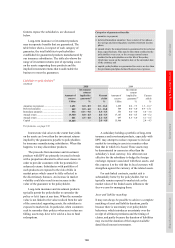
features expose the subsidiaries, are discussed
below.
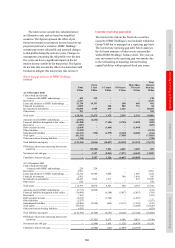
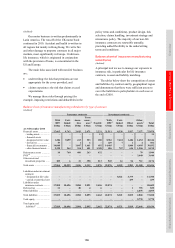
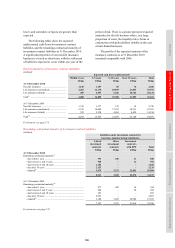
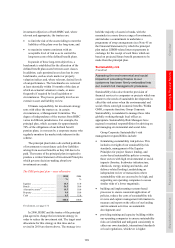
Long-term insurance or investment products
may incorporate benefits that are guaranteed. The
table below shows, in respect of each category of
guarantee, the total liabilities to policyholders
established for guaranteed products manufactured by
our insurance subsidiaries. The table also shows the
range of investment returns (net of operating costs)
on the assets supporting these products and the
implied investment returns that would enable the
business to meet the guarantees.
Categories of guaranteed benefits
• annuities in payment;
• deferred/immediate annuities: these consist of two phases –
the savings and investing phase and the retirement income
phase;
• annual return: the annual return is guaranteed to be no lower
than a specified rate. This may be the return credited to the
policyholder every year, or the average annual return
credited to the policyholder over the life of the policy,
which may occur on the maturity date or the surrender date
of the contract; and
• capital: policyholders are guaranteed to receive no less than
the premiums paid plus declared bonuses less expenses.
Liabilities to policyholders87
(Audited)
2010 2009
Amount of
reserve
Investment
returns
implied by
guarantee81
Current
yields
Amount of
reserve
Investment
returns
implied by
guarantee82
Current
yields
US$m % % US$m % %
Annuities in payment ............................... 1,491 0.0 – 8.5 1.5 – 16.2 1,299 0.0 – 7.5 1.3 – 16.7
Deferred annuities ................................... 642 0.0 – 6.0 2.1 – 16.8 569 0.0 – 6.0 0.9 – 15.1
Immediate annuities ................................. 532 6.0 -– 9.0 5.5 – 5.5 553 6.0 – 9.0 5.4 – 5.4
Annual return ........................................... 19,980 0.0 – 4.5 0.0 – 5.9 17,147 0.0 – 4.5 0.8 – 6.2
Annual return ........................................... 841 4.5 – 6.0 6.1 – 8.5 497 4.5 – 6.0 5.1 – 6.5
Capital ...................................................... 15,445
– 2.0 – 4.0 15,866 – 2.4 – 4.3
For footnotes, see page 174.
Interest rate risk arises to the extent that yields
on the assets are lower than the investment returns
implied by the guarantees payable to policyholders
by insurance manufacturing subsidiaries. When this
happens, we may discontinue products.
The proceeds from insurance and investment
products with DPF are primarily invested in bonds
with a proportion allocated to other asset classes in
order to provide customers with the potential for
enhanced returns. Subsidiaries with portfolios of
such products are exposed to the risk of falls in
market prices which cannot be fully reflected in
the discretionary bonuses. An increase in market
volatility could also result in an increase in the
value of the guarantee to the policyholder.
Long-term insurance and investment products
typically permit the policyholder to surrender the
policy or let it lapse at any time. When the surrender
value is not linked to the value realised from the sale
of the associated supporting assets, the subsidiary is
exposed to market risk. In particular, when customers
seek to surrender their policies when asset values are
falling, assets may have to be sold at a loss to fund
redemptions.
A subsidiary holding a portfolio of long-term
insurance and investment products, especially with
DPF, may attempt to reduce exposure to its local
market by investing in assets in countries other
than that in which it is based. These assets may
be denominated in currencies other than the
subsidiary’s local currency. It is often not cost
effective for the subsidiary to hedge the foreign
exchange exposure associated with these assets, and
this exposes it to the risk that its local currency will
strengthen against the currency of the related assets.
For unit-linked contracts, market risk is
substantially borne by the policyholder, but we
typically remain exposed to market risk as the
market value of the linked assets influences the
fees we earn for managing them.
Asset and liability matching
It may not always be possible to achieve a complete
matching of asset and liability durations, partly
because there is uncertainty over policyholder
behaviour, which introduces uncertainty over the
receipt of all future premiums and the timing of
claims, and partly because the duration of liabilities
may exceed the duration of the longest available
dated fixed interest investments.