HSBC 2010 Annual Report Download - page 277
Download and view the complete annual report
Please find page 277 of the 2010 HSBC annual report below. You can navigate through the pages in the report by either clicking on the pages listed below, or by using the keyword search tool below to find specific information within the annual report.-
 1
1 -
2
-
3
-
4
-
5
-
6
-
7
-
8
-
9
-
10
-
11
-
12
-
13
-
14
-
15
-
16
-
17
-
18
-
19
-
20
-
21
-
22
-
23
-
24
-
25
-
26
-
27
-
28
-
29
-
30
-
31
-
32
-
33
-
34
-
35
-
36
-
37
-
38
-
39
-
40
-
41
-
42
-
43
-
44
-
45
-
46
-
47
-
48
-
49
-
50
-
51
-
52
-
53
-
54
-
55
-
56
-
57
-
58
-
59
-
60
-
61
-
62
-
63
-
64
-
65
-
66
-
67
-
68
-
69
-
70
-
71
-
72
-
73
-
74
-
75
-
76
-
77
-
78
-
79
-
80
-
81
-
82
-
83
-
84
-
85
-
86
-
87
-
88
-
89
-
90
-
91
-
92
-
93
-
94
-
95
-
96
-
97
-
98
-
99
-
100
-
101
-
102
-
103
-
104
-
105
-
106
-
107
-
108
-
109
-
110
-
111
-
112
-
113
-
114
-
115
-
116
-
117
-
118
-
119
-
120
-
121
-
122
-
123
-
124
-
125
-
126
-
127
-
128
-
129
-
130
-
131
-
132
-
133
-
134
-
135
-
136
-
137
-
138
-
139
-
140
-
141
-
142
-
143
-
144
-
145
-
146
-
147
-
148
-
149
-
150
-
151
-
152
-
153
-
154
-
155
-
156
-
157
-
158
-
159
-
160
-
161
-
162
-
163
-
164
-
165
-
166
-
167
-
168
-
169
-
170
-
171
-
172
-
173
-
174
-
175
-
176
-
177
-
178
-
179
-
180
-
181
-
182
-
183
-
184
-
185
-
186
-
187
-
188
-
189
-
190
-
191
-
192
-
193
-
194
-
195
-
196
-
197
-
198
-
199
-
200
-
201
-
202
-
203
-
204
-
205
-
206
-
207
-
208
-
209
-
210
-
211
-
212
-
213
-
214
-
215
-
216
-
217
-
218
-
219
-
220
-
221
-
222
-
223
-
224
-
225
-
226
-
227
-
228
-
229
-
230
-
231
-
232
-
233
-
234
-
235
-
236
-
237
-
238
-
239
-
240
-
241
-
242
-
243
-
244
-
245
-
246
-
247
-
248
-
249
-
250
-
251
-
252
-
253
-
254
-
255
-
256
-
257
-
258
-
259
-
260
-
261
-
262
-
263
-
264
-
265
-
266
-
 267
267 -
 268
268 -
 269
269 -
 270
270 -
 271
271 -
 272
272 -
 273
273 -
 274
274 -
 275
275 -
 276
276 -
 277
277 -
 278
278 -
 279
279 -
 280
280 -
 281
281 -
 282
282 -
 283
283 -
 284
284 -
 285
285 -
 286
286 -
 287
287 -
288
-
289
-
290
-
291
-
292
-
293
-
294
-
295
-
296
-
297
-
298
-
299
-
300
-
301
-
302
-
303
-
304
-
305
-
306
-
307
-
308
-
309
-
310
-
311
-
312
-
313
-
314
-
315
-
316
-
317
-
318
-
319
-
320
-
321
-
322
-
323
-
324
-
325
-
326
-
327
-
328
-
329
-
330
-
331
-
332
-
333
-
334
-
335
-
336
-
337
-
338
-
339
-
340
-
341
-
342
-
343
-
344
-
345
-
346
-
347
-
348
-
349
-
350
-
351
-
352
-
353
-
354
-
355
-
356
-
357
-
358
-
359
-
360
-
361
-
362
-
363
-
364
-
365
-
366
-
367
-
368
-
369
-
370
-
371
-
372
-
373
-
374
-
375
-
376
-
377
-
378
-
379
-
380
-
381
-
382
-
383
-
384
-
385
-
386
-
387
-
388
-
389
-
390
-
391
-
392
-
393
-
394
-
395
-
396
 |
 |

275
Overview Operating & Financial Review Governance Financial Statements Shareholder Information
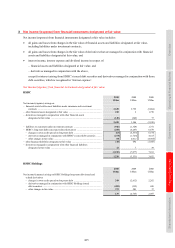
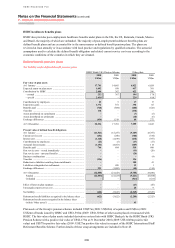
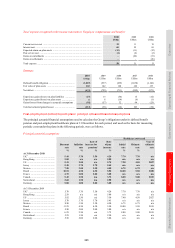
Cumulative actuarial gains/(losses) recognised in other comprehensive income
2010 2009
US$m US$m
At 1 January ............................................................................................................................................... (4,660) (1,074)
HSBC Bank (UK) Pension Scheme .......................................................................................................... 321 (3,692)
Other plans ................................................................................................................................................. (275) 179
Healthcare plans ........................................................................................................................................ (112) (36)
Change in the effect of limit on plan surpluses1 ........................................................................................ 6 (37)
Total actuarial losses recognised in other comprehensive income ........................................................... (60) (3,586)
At 31 December2 ........................................................................................................................................ (4,720) (4,660)
1 Excludes exchange differences of US$6m (2009: US$1m).
2 Includes cumulative movements related to the limit on plan surpluses. This limit is US$47m at 31 December 2010 (2009: US$47m).
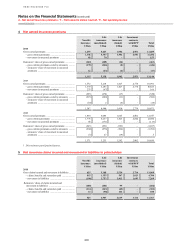
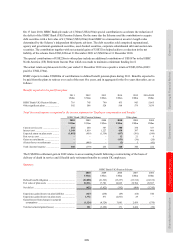
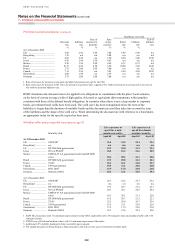
HSBC pension plans
2010 2009 2008
Number of plans worldwide ........................................................................................ 218 211 205
% % %
Percentage of HSBC employees:
– enrolled in defined contribution plans ................................................................. 63 59 50
– enrolled in defined benefit plans .......................................................................... 27 29 36
– covered by HSBC pension plans .......................................................................... 90 88 86
HSBC has been progressively offering all new employees membership of defined contribution plans.
The majority of the Group’s defined benefit plans are funded plans. The assets of most of the larger plans are held in
trusts or similar funds separate from HSBC. The plans are reviewed at least annually or in accordance with local
practice and regulations by qualified actuaries. The actuarial assumptions used to calculate the defined benefit
obligations and related current service costs vary according to the economic conditions of the countries in which the
plans are situated.
Pension plans in the UK
The largest plan exists in the UK, where the HSBC Bank (UK) Pension Scheme (‘the Scheme’) covers employees of
HSBC Bank plc and certain other employees of HSBC. This comprises a funded defined benefit plan (‘the principal
plan’), which is closed to new entrants, and a defined contribution plan which was established in July 1996 for new
employees.
The latest actuarial valuation of the principal plan was made as at 31 December 2008 by C G Singer, Fellow of the
Institute of Actuaries, of Towers Watson Limited. At that date, the market value of the HSBC Bank (UK) Pension
Scheme’s assets was £10.6bn (US$15.5bn) (including assets relating to the defined benefit plan, the defined contribution
plan and additional voluntary contributions). The market value of the plan assets represented 77% of the amount
expected to be required, on the basis of the assumptions adopted, to provide the benefits accrued to members after
allowing for expected future increases in earnings, and the resulting deficit amounted to £3.2bn (US$4.7bn). The
method adopted for this investigation was the projected unit method.
The expected cash flows from the principal plan were projected by reference to the Retail Price Index (‘RPI’) swap
break-even curve at 31 December 2008. Salary increases were assumed to be 0.5% per annum above RPI and
inflationary pension increases, subject to a minimum of zero per cent and a maximum of 5% (maximum of 3% per
annum in respect of service accrued since 1 July 2009), were assumed to be in line with RPI. The projected cash
flows were discounted at the LIBOR swap curve at 31 December 2008 plus a margin for the expected return on the
investment strategy of 190 basis points per annum. The mortality experience of the principal plan’s pensioners over
the three year period since the previous valuation was analysed and, on the basis of this analysis, the mortality
assumptions were set based on the SAPS S1 series of tables which best fit the pensioner experience. Allowance was
made for future improvements to mortality rates in line with the medium cohort projections with a minimum
improvement rate set at 1.75% for males and 1.25% for females. The benefits payable from the defined benefit plan
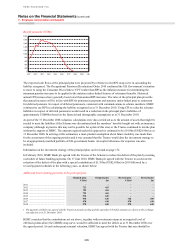
are expected to be as shown in the chart below.