HSBC 2010 Annual Report Download - page 54
Download and view the complete annual report
Please find page 54 of the 2010 HSBC annual report below. You can navigate through the pages in the report by either clicking on the pages listed below, or by using the keyword search tool below to find specific information within the annual report.-
 1
1 -
2
-
3
-
4
-
5
-
6
-
7
-
8
-
9
-
10
-
11
-
12
-
13
-
14
-
15
-
16
-
17
-
18
-
19
-
20
-
21
-
22
-
23
-
24
-
25
-
26
-
27
-
28
-
29
-
30
-
31
-
32
-
33
-
34
-
35
-
36
-
37
-
38
-
39
-
40
-
41
-
42
-
43
-
 44
44 -
 45
45 -
 46
46 -
 47
47 -
 48
48 -
 49
49 -
 50
50 -
 51
51 -
 52
52 -
 53
53 -
 54
54 -
 55
55 -
 56
56 -
 57
57 -
 58
58 -
 59
59 -
 60
60 -
 61
61 -
 62
62 -
 63
63 -
 64
64 -
65
-
66
-
67
-
68
-
69
-
70
-
71
-
72
-
73
-
74
-
75
-
76
-
77
-
78
-
79
-
80
-
81
-
82
-
83
-
84
-
85
-
86
-
87
-
88
-
89
-
90
-
91
-
92
-
93
-
94
-
95
-
96
-
97
-
98
-
99
-
100
-
101
-
102
-
103
-
104
-
105
-
106
-
107
-
108
-
109
-
110
-
111
-
112
-
113
-
114
-
115
-
116
-
117
-
118
-
119
-
120
-
121
-
122
-
123
-
124
-
125
-
126
-
127
-
128
-
129
-
130
-
131
-
132
-
133
-
134
-
135
-
136
-
137
-
138
-
139
-
140
-
141
-
142
-
143
-
144
-
145
-
146
-
147
-
148
-
149
-
150
-
151
-
152
-
153
-
154
-
155
-
156
-
157
-
158
-
159
-
160
-
161
-
162
-
163
-
164
-
165
-
166
-
167
-
168
-
169
-
170
-
171
-
172
-
173
-
174
-
175
-
176
-
177
-
178
-
179
-
180
-
181
-
182
-
183
-
184
-
185
-
186
-
187
-
188
-
189
-
190
-
191
-
192
-
193
-
194
-
195
-
196
-
197
-
198
-
199
-
200
-
201
-
202
-
203
-
204
-
205
-
206
-
207
-
208
-
209
-
210
-
211
-
212
-
213
-
214
-
215
-
216
-
217
-
218
-
219
-
220
-
221
-
222
-
223
-
224
-
225
-
226
-
227
-
228
-
229
-
230
-
231
-
232
-
233
-
234
-
235
-
236
-
237
-
238
-
239
-
240
-
241
-
242
-
243
-
244
-
245
-
246
-
247
-
248
-
249
-
250
-
251
-
252
-
253
-
254
-
255
-
256
-
257
-
258
-
259
-
260
-
261
-
262
-
263
-
264
-
265
-
266
-
267
-
268
-
269
-
270
-
271
-
272
-
273
-
274
-
275
-
276
-
277
-
278
-
279
-
280
-
281
-
282
-
283
-
284
-
285
-
286
-
287
-
288
-
289
-
290
-
291
-
292
-
293
-
294
-
295
-
296
-
297
-
298
-
299
-
300
-
301
-
302
-
303
-
304
-
305
-
306
-
307
-
308
-
309
-
310
-
311
-
312
-
313
-
314
-
315
-
316
-
317
-
318
-
319
-
320
-
321
-
322
-
323
-
324
-
325
-
326
-
327
-
328
-
329
-
330
-
331
-
332
-
333
-
334
-
335
-
336
-
337
-
338
-
339
-
340
-
341
-
342
-
343
-
344
-
345
-
346
-
347
-
348
-
349
-
350
-
351
-
352
-
353
-
354
-
355
-
356
-
357
-
358
-
359
-
360
-
361
-
362
-
363
-
364
-
365
-
366
-
367
-
368
-
369
-
370
-
371
-
372
-
373
-
374
-
375
-
376
-
377
-
378
-
379
-
380
-
381
-
382
-
383
-
384
-
385
-
386
-
387
-
388
-
389
-
390
-
391
-
392
-
393
-
394
-
395
-
396
 |
 |

HSBC HOLDINGS PLC
Report of the Directors: Operating and Financial Review (continued)
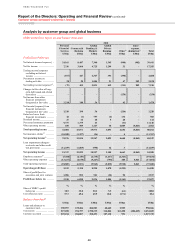
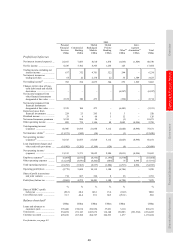
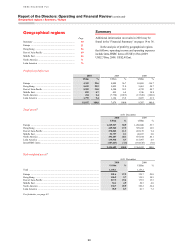
Geographical regions > Europe
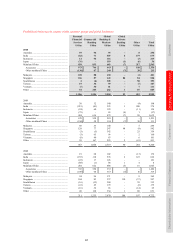
52
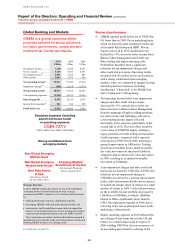
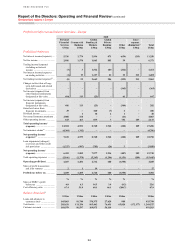
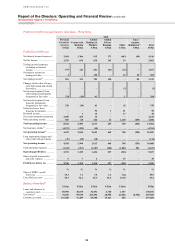
Profit/(loss) before tax by country within customer groups and global businesses
Personal
Financial
Services
US$m
Commercial
Banking
US$m
Global
Banking &
Markets
US$m
Global
Private
Banking
US$m
Other
US$m
Total
US$m
2010
UK ..................................................................... 1,223 827 1,730 223 (1,605) 2,398
France60 ............................................................. 109 135 405 18 26 693
Germany ........................................................... – 32 267 30 4 333
Malta ................................................................. 35 56 19 – – 110
Switzerland ....................................................... – (5) – 265 – 260
Turkey ............................................................... 64 80 105 1 – 250
Other ................................................................. (142) 80 200 103 17 258
1,289 1,205 2,726 640 (1,558) 4,302
2009
UK ..................................................................... 364 1,026 3,045 252 (2,561) 2,126
France60 ............................................................. 54 102 894 3 (429) 624
Germany ........................................................... – 21 255 32 (18) 290
Malta ................................................................. 33 58 9 – – 100
Switzerland ....................................................... – – 5 448 (3) 450
Turkey ............................................................... 43 97 119 2 – 261
Other ................................................................. (182) (12) 218 117 17 158
312 1,292 4,545 854 (2,994) 4,009
2008
UK ..................................................................... 1,546 2,361 (469) 250 2,997 6,685
France60 ............................................................. 139 176 273 10 2,242 2,840
Germany ........................................................... – 31 184 32 (22) 225
Malta ................................................................. 59 67 16 – – 142
Switzerland ....................................................... – – – 553 – 553
Turkey ............................................................... 3 91 130 – – 224
Other ................................................................. (89) (4) 61 153 79 200
1,658 2,722 195 998 5,296 10,869
For footnote, see page 83.
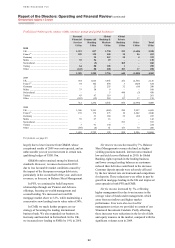
largely due to lower income from GB&M, whose
exceptional results of 2009 were not repeated, and an
unfavourable year on year movement in certain non-
qualifying hedges of US$1.1bn.
GB&M results remained strong by historical
standards. However, revenues decreased in 2010
due to less favourable market conditions caused by
the impact of the European sovereign debt crisis,
particularly in the second half of the year, and lower
revenues, as forecast, in Balance Sheet Management.
In PFS, we continued to build long-term
relationships through our Premier and Advance
offerings, focusing on wealth management and
secured lending. We increased our total UK
mortgage market share to 5.2%, while maintaining a
conservative new lending loan to value ratio of 54%.
In CMB, we made further progress on our
strategy of becoming the leading international
business bank. We also expanded our business in
Germany and launched in Switzerland. In the UK,
we increased new lending to SMEs by 19% in 2010.
Net interest income decreased by 7%. Balance
Sheet Management revenues declined, as higher-
yielding positions matured, interest rates remained
low and yield curves flattened in 2010. In Global
Banking, tighter spreads in the lending business
and lower average lending balances as customers
reduced their debt also contributed to the decrease.
Customer deposit spreads were adversely affected
by the low interest rate environment and competition
for deposits. These reductions were offset in part by
growth in mortgage lending in the UK and improved
asset spreads in both PFS and CMB.
Net fee income increased by 7%, reflecting
higher management fees due to an increase in the
average value of funds under management, which
arose from net inflows and higher market
performance. Fees were also received for
management services we provided to certain of our
Structured Investment Conduits. Partly offsetting
these increases were reductions in the levels of debt
and equity issuance in the market, compared with the
significant volumes seen in 2009.