HSBC 2010 Annual Report Download - page 131
Download and view the complete annual report
Please find page 131 of the 2010 HSBC annual report below. You can navigate through the pages in the report by either clicking on the pages listed below, or by using the keyword search tool below to find specific information within the annual report.-
 1
1 -
2
-
3
-
4
-
5
-
6
-
7
-
8
-
9
-
10
-
11
-
12
-
13
-
14
-
15
-
16
-
17
-
18
-
19
-
20
-
21
-
22
-
23
-
24
-
25
-
26
-
27
-
28
-
29
-
30
-
31
-
32
-
33
-
34
-
35
-
36
-
37
-
38
-
39
-
40
-
41
-
42
-
43
-
44
-
45
-
46
-
47
-
48
-
49
-
50
-
51
-
52
-
53
-
54
-
55
-
56
-
57
-
58
-
59
-
60
-
61
-
62
-
63
-
64
-
65
-
66
-
67
-
68
-
69
-
70
-
71
-
72
-
73
-
74
-
75
-
76
-
77
-
78
-
79
-
80
-
81
-
82
-
83
-
84
-
85
-
86
-
87
-
88
-
89
-
90
-
91
-
92
-
93
-
94
-
95
-
96
-
97
-
98
-
99
-
100
-
101
-
102
-
103
-
104
-
105
-
106
-
107
-
108
-
109
-
110
-
111
-
112
-
113
-
114
-
115
-
116
-
117
-
118
-
119
-
120
-
 121
121 -
 122
122 -
 123
123 -
 124
124 -
 125
125 -
 126
126 -
 127
127 -
 128
128 -
 129
129 -
 130
130 -
 131
131 -
 132
132 -
 133
133 -
 134
134 -
 135
135 -
 136
136 -
 137
137 -
 138
138 -
 139
139 -
 140
140 -
 141
141 -
142
-
143
-
144
-
145
-
146
-
147
-
148
-
149
-
150
-
151
-
152
-
153
-
154
-
155
-
156
-
157
-
158
-
159
-
160
-
161
-
162
-
163
-
164
-
165
-
166
-
167
-
168
-
169
-
170
-
171
-
172
-
173
-
174
-
175
-
176
-
177
-
178
-
179
-
180
-
181
-
182
-
183
-
184
-
185
-
186
-
187
-
188
-
189
-
190
-
191
-
192
-
193
-
194
-
195
-
196
-
197
-
198
-
199
-
200
-
201
-
202
-
203
-
204
-
205
-
206
-
207
-
208
-
209
-
210
-
211
-
212
-
213
-
214
-
215
-
216
-
217
-
218
-
219
-
220
-
221
-
222
-
223
-
224
-
225
-
226
-
227
-
228
-
229
-
230
-
231
-
232
-
233
-
234
-
235
-
236
-
237
-
238
-
239
-
240
-
241
-
242
-
243
-
244
-
245
-
246
-
247
-
248
-
249
-
250
-
251
-
252
-
253
-
254
-
255
-
256
-
257
-
258
-
259
-
260
-
261
-
262
-
263
-
264
-
265
-
266
-
267
-
268
-
269
-
270
-
271
-
272
-
273
-
274
-
275
-
276
-
277
-
278
-
279
-
280
-
281
-
282
-
283
-
284
-
285
-
286
-
287
-
288
-
289
-
290
-
291
-
292
-
293
-
294
-
295
-
296
-
297
-
298
-
299
-
300
-
301
-
302
-
303
-
304
-
305
-
306
-
307
-
308
-
309
-
310
-
311
-
312
-
313
-
314
-
315
-
316
-
317
-
318
-
319
-
320
-
321
-
322
-
323
-
324
-
325
-
326
-
327
-
328
-
329
-
330
-
331
-
332
-
333
-
334
-
335
-
336
-
337
-
338
-
339
-
340
-
341
-
342
-
343
-
344
-
345
-
346
-
347
-
348
-
349
-
350
-
351
-
352
-
353
-
354
-
355
-
356
-
357
-
358
-
359
-
360
-
361
-
362
-
363
-
364
-
365
-
366
-
367
-
368
-
369
-
370
-
371
-
372
-
373
-
374
-
375
-
376
-
377
-
378
-
379
-
380
-
381
-
382
-
383
-
384
-
385
-
386
-
387
-
388
-
389
-
390
-
391
-
392
-
393
-
394
-
395
-
396
 |
 |

129
Overview Operating & Financial Review Governance Financial Statements Shareholder Information
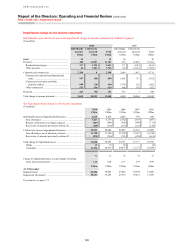
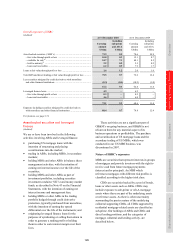
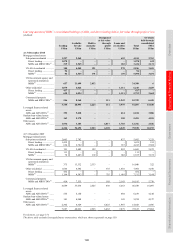
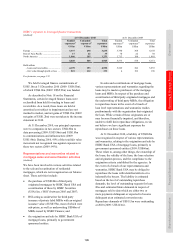
Overall exposure of HSBC
(Audited)
At 31 December 2010 At 31 December 2009
Carrying
amount
Including
sub-prime
and Alt-A
Carrying
amount
Including
sub-prime
and Alt-A
US$bn US$bn US$bn US$bn
Asset-backed securities (‘ABS’s) ............................................................. 73.9 8.5 70.6 10.8
– fair value through profit or loss ........................................................ 10.8 0.3 12.1 0.7
– available for sale38 ............................................................................. 54.7 7.1 48.1 8.2
– held to maturity38 ............................................................................... 2.2 0.2 2.5 0.2
– loans and receivables ......................................................................... 6.2 0.9 7.9 1.7
Loans at fair value through profit or loss ................................................. 1.6 1.2 2.0 1.6
Total ABS and direct lending at fair value through profit or loss ........... 75.5 9.7 72.6 12.4
Less securities mitigated by credit derivatives with monolines
and other financial institutions ............................................................. (8.3) (0.4) (10.2) (1.0)
67.2 9.3 62.4 11.4
Leveraged finance loans ........................................................................... 4.9 – 6.2 –
– fair value through profit or loss ........................................................ 0.3 – 0.2 –
– loans and receivables ......................................................................... 4.6 – 6.0 –
72.1 9.3 68.6 11.4
Exposure including securities mitigated by credit derivatives
with monolines and other financial institutions ................................... 80.4 9.7 78.8 12.4
For footnote, see page 174.
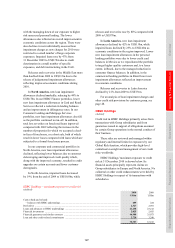
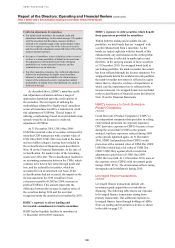
Asset-backed securities and leveraged
finance
(Audited)
We are or have been involved in the following
activities involving ABSs and leveraged finance:
• purchasing US mortgage loans with the
intention of structuring and placing
securitisations into the market;
• trading in ABSs, including MBSs, in secondary
markets;
• holding MBSs and other ABSs in balance sheet
management activities, with the intention of
earning net interest income over the life of the
securities;
• holding MBSs and other ABSs as part of
investment portfolios, including securities
investment conduits (‘SIC’s) and money market
funds, as described in Note 43 on the Financial
Statements, with the intention of earning net
interest income and management fees;
• holding MBSs or other ABSs in the trading
portfolio hedged through credit derivative
protection, typically purchased from monolines,
with the intention of earning the spread
differential over the life of the instruments; and
• originating leveraged finance loans for the
purposes of syndicating or selling them down in
order to generate a trading profit or holding
them in order to earn interest margin over their
lives.
These activities are not a significant part of
GB&M’s on-going business, and GB&M is not
reliant on them for any material aspect of its
business operations or profitability. The purchase
and securitisation of US mortgage loans and the
secondary trading of US MBSs, which was
conducted in our US MBS business, was
discontinued in 2007.
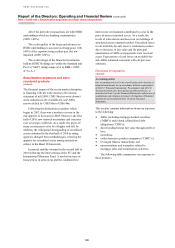
Nature of HSBC’s exposures
MBSs are securities that represent interests in groups
of mortgages and provide investors with the right to
receive cash from future mortgage payments
(interest and/or principal). An MBS which
references mortgages with different risk profiles is
classified according to the highest risk class.
CDOs are securities backed by a pool of bonds,
loans or other assets such as ABSs. CDOs may
include exposure to sub-prime or Alt-A mortgage
assets where these are part of the underlying assets
or reference assets. As there is often uncertainty
surrounding the precise nature of the underlying
collateral supporting CDOs, all CDOs supported by
residential mortgage-related assets are classified as
sub-prime. Our holdings of ABSs and CDOs and
direct lending positions, and the categories of
mortgage collateral and lending activity, are
described below.