HSBC 2010 Annual Report Download - page 31
Download and view the complete annual report
Please find page 31 of the 2010 HSBC annual report below. You can navigate through the pages in the report by either clicking on the pages listed below, or by using the keyword search tool below to find specific information within the annual report.-
 1
1 -
2
-
3
-
4
-
5
-
6
-
7
-
8
-
9
-
10
-
11
-
12
-
13
-
14
-
15
-
16
-
17
-
18
-
19
-
20
-
 21
21 -
 22
22 -
 23
23 -
 24
24 -
 25
25 -
 26
26 -
 27
27 -
 28
28 -
 29
29 -
 30
30 -
 31
31 -
 32
32 -
 33
33 -
 34
34 -
 35
35 -
 36
36 -
 37
37 -
 38
38 -
 39
39 -
 40
40 -
 41
41 -
42
-
43
-
44
-
45
-
46
-
47
-
48
-
49
-
50
-
51
-
52
-
53
-
54
-
55
-
56
-
57
-
58
-
59
-
60
-
61
-
62
-
63
-
64
-
65
-
66
-
67
-
68
-
69
-
70
-
71
-
72
-
73
-
74
-
75
-
76
-
77
-
78
-
79
-
80
-
81
-
82
-
83
-
84
-
85
-
86
-
87
-
88
-
89
-
90
-
91
-
92
-
93
-
94
-
95
-
96
-
97
-
98
-
99
-
100
-
101
-
102
-
103
-
104
-
105
-
106
-
107
-
108
-
109
-
110
-
111
-
112
-
113
-
114
-
115
-
116
-
117
-
118
-
119
-
120
-
121
-
122
-
123
-
124
-
125
-
126
-
127
-
128
-
129
-
130
-
131
-
132
-
133
-
134
-
135
-
136
-
137
-
138
-
139
-
140
-
141
-
142
-
143
-
144
-
145
-
146
-
147
-
148
-
149
-
150
-
151
-
152
-
153
-
154
-
155
-
156
-
157
-
158
-
159
-
160
-
161
-
162
-
163
-
164
-
165
-
166
-
167
-
168
-
169
-
170
-
171
-
172
-
173
-
174
-
175
-
176
-
177
-
178
-
179
-
180
-
181
-
182
-
183
-
184
-
185
-
186
-
187
-
188
-
189
-
190
-
191
-
192
-
193
-
194
-
195
-
196
-
197
-
198
-
199
-
200
-
201
-
202
-
203
-
204
-
205
-
206
-
207
-
208
-
209
-
210
-
211
-
212
-
213
-
214
-
215
-
216
-
217
-
218
-
219
-
220
-
221
-
222
-
223
-
224
-
225
-
226
-
227
-
228
-
229
-
230
-
231
-
232
-
233
-
234
-
235
-
236
-
237
-
238
-
239
-
240
-
241
-
242
-
243
-
244
-
245
-
246
-
247
-
248
-
249
-
250
-
251
-
252
-
253
-
254
-
255
-
256
-
257
-
258
-
259
-
260
-
261
-
262
-
263
-
264
-
265
-
266
-
267
-
268
-
269
-
270
-
271
-
272
-
273
-
274
-
275
-
276
-
277
-
278
-
279
-
280
-
281
-
282
-
283
-
284
-
285
-
286
-
287
-
288
-
289
-
290
-
291
-
292
-
293
-
294
-
295
-
296
-
297
-
298
-
299
-
300
-
301
-
302
-
303
-
304
-
305
-
306
-
307
-
308
-
309
-
310
-
311
-
312
-
313
-
314
-
315
-
316
-
317
-
318
-
319
-
320
-
321
-
322
-
323
-
324
-
325
-
326
-
327
-
328
-
329
-
330
-
331
-
332
-
333
-
334
-
335
-
336
-
337
-
338
-
339
-
340
-
341
-
342
-
343
-
344
-
345
-
346
-
347
-
348
-
349
-
350
-
351
-
352
-
353
-
354
-
355
-
356
-
357
-
358
-
359
-
360
-
361
-
362
-
363
-
364
-
365
-
366
-
367
-
368
-
369
-
370
-
371
-
372
-
373
-
374
-
375
-
376
-
377
-
378
-
379
-
380
-
381
-
382
-
383
-
384
-
385
-
386
-
387
-
388
-
389
-
390
-
391
-
392
-
393
-
394
-
395
-
396
 |
 |

29
Overview Operating & Financial Review Governance Financial Statements Shareholder Information
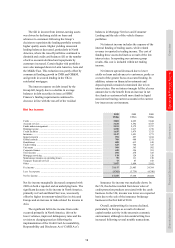
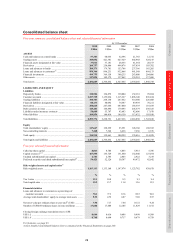
Consolidated balance sheet
Five-year summary consolidated balance sheet and selected financial information
At 31 December
2010
US$m
2009
US$m
2008
US$m
2007
US$m
2006
US$m
ASSETS
Cash and balances at central banks ............................................. 57,383 60,655 52,396 21,765 12,732
Trading assets .............................................................................. 385,052 421,381 427,329 445,968 328,147
Financial assets designated at fair value ..................................... 37,011 37,181 28,533 41,564 20,573
Derivatives ................................................................................... 260,757 250,886 494,876 187,854 103,702
Loans and advances to banks ...................................................... 208,271 179,781 153,766 237,366 185,205
Loans and advances to customers35 ............................................. 958,366 896,231 932,868 981,548 868,133
Financial investments .................................................................. 400,755 369,158 300,235 283,000 204,806
Other assets .................................................................................. 147,094 149,179 137,462 155,201 137,460
Total assets .................................................................................. 2,454,689 2,364,452 2,527,465 2,354,266 1,860,758
LIABILITIES AND EQUITY
Liabilities
Deposits by banks ........................................................................ 110,584 124,872 130,084 132,181 99,694
Customer accounts ....................................................................... 1,227,725 1,159,034 1,115,327 1,096,140 896,834
Trading liabilities ......................................................................... 300,703 268,130 247,652 314,580 226,608
Financial liabilities designated at fair value ................................ 88,133 80,092 74,587 89,939 70,211
Derivatives ................................................................................... 258,665 247,646 487,060 183,393 101,478
Debt securities in issue ................................................................ 145,401 146,896 179,693 246,579 230,325
Liabilities under insurance contracts ........................................... 58,609 53,707 43,683 42,606 17,670
Other liabilities ............................................................................ 109,954 148,414 149,150 113,432 103,010
Total liabilities ............................................................................. 2,299,774 2,228,791 2,427,236 2,218,850 1,745,830
Equity
Total shareholders’ equity ........................................................... 147,667 128,299 93,591 128,160 108,352
Non-controlling interests ............................................................. 7,248 7,362 6,638 7,256 6,576
Total equity .................................................................................. 154,915 135,661 100,229 135,416 114,928
Total equity and liabilities ........................................................... 2,454,689 2,364,452 2,527,465 2,354,266 1,860,758
Five-year selected financial information
Called up share capital ................................................................. 8,843 8,705 6,053 5,915 5,786
Capital resources36,37 .................................................................... 167,555 155,729 131,460 152,640 127,074
Undated subordinated loan capital .............................................. 2,781 2,785 2,843 2,922 3,219
Preferred securities and dated subordinated loan capital38 ......... 54,421 52,126 50,307 49,472 42,642
Risk weighted assets and capital ratios36
Risk weighted assets .................................................................... 1,103,113 1,133,168 1,147,974 1,123,782 938,678
% % % % %
Tier 1 ratio ................................................................................... 12.1 10.8 8.3 9.3 9.4
Total capital ratio ......................................................................... 15.2 13.7 11.4 13.6 13.5
Financial statistics
Loans and advances to customers as a percentage of
customer accounts ................................................................... 78.1 77.3 83.6
89.5 96.8
Average total shareholders’ equity to average total assets ......... 5.53 4.72 4.87 5.69 5.97
Net asset value per ordinary share at year-end39 (US$) .............. 7.94 7.17 7.44 10.72 9.24
Number of US$0.50 ordinary shares in issue (millions) ............. 17,686 17,408 12,105 11,829 11,572
Closing foreign exchange translation rates to US$:
US$1: £ ........................................................................................ 0.644 0.616 0.686 0.498 0.509
US$1: € ........................................................................................ 0.748 0.694 0.717 0.679 0.759
For footnotes, see page 83.
A more detailed consolidated balance sheet is contained in the Financial Statements on page 240.