HSBC 2010 Annual Report Download - page 163
Download and view the complete annual report
Please find page 163 of the 2010 HSBC annual report below. You can navigate through the pages in the report by either clicking on the pages listed below, or by using the keyword search tool below to find specific information within the annual report.-
 1
1 -
2
-
3
-
4
-
5
-
6
-
7
-
8
-
9
-
10
-
11
-
12
-
13
-
14
-
15
-
16
-
17
-
18
-
19
-
20
-
21
-
22
-
23
-
24
-
25
-
26
-
27
-
28
-
29
-
30
-
31
-
32
-
33
-
34
-
35
-
36
-
37
-
38
-
39
-
40
-
41
-
42
-
43
-
44
-
45
-
46
-
47
-
48
-
49
-
50
-
51
-
52
-
53
-
54
-
55
-
56
-
57
-
58
-
59
-
60
-
61
-
62
-
63
-
64
-
65
-
66
-
67
-
68
-
69
-
70
-
71
-
72
-
73
-
74
-
75
-
76
-
77
-
78
-
79
-
80
-
81
-
82
-
83
-
84
-
85
-
86
-
87
-
88
-
89
-
90
-
91
-
92
-
93
-
94
-
95
-
96
-
97
-
98
-
99
-
100
-
101
-
102
-
103
-
104
-
105
-
106
-
107
-
108
-
109
-
110
-
111
-
112
-
113
-
114
-
115
-
116
-
117
-
118
-
119
-
120
-
121
-
122
-
123
-
124
-
125
-
126
-
127
-
128
-
129
-
130
-
131
-
132
-
133
-
134
-
135
-
136
-
137
-
138
-
139
-
140
-
141
-
142
-
143
-
144
-
145
-
146
-
147
-
148
-
149
-
150
-
151
-
152
-
 153
153 -
 154
154 -
 155
155 -
 156
156 -
 157
157 -
 158
158 -
 159
159 -
 160
160 -
 161
161 -
 162
162 -
 163
163 -
 164
164 -
 165
165 -
 166
166 -
 167
167 -
 168
168 -
 169
169 -
 170
170 -
 171
171 -
 172
172 -
 173
173 -
174
-
175
-
176
-
177
-
178
-
179
-
180
-
181
-
182
-
183
-
184
-
185
-
186
-
187
-
188
-
189
-
190
-
191
-
192
-
193
-
194
-
195
-
196
-
197
-
198
-
199
-
200
-
201
-
202
-
203
-
204
-
205
-
206
-
207
-
208
-
209
-
210
-
211
-
212
-
213
-
214
-
215
-
216
-
217
-
218
-
219
-
220
-
221
-
222
-
223
-
224
-
225
-
226
-
227
-
228
-
229
-
230
-
231
-
232
-
233
-
234
-
235
-
236
-
237
-
238
-
239
-
240
-
241
-
242
-
243
-
244
-
245
-
246
-
247
-
248
-
249
-
250
-
251
-
252
-
253
-
254
-
255
-
256
-
257
-
258
-
259
-
260
-
261
-
262
-
263
-
264
-
265
-
266
-
267
-
268
-
269
-
270
-
271
-
272
-
273
-
274
-
275
-
276
-
277
-
278
-
279
-
280
-
281
-
282
-
283
-
284
-
285
-
286
-
287
-
288
-
289
-
290
-
291
-
292
-
293
-
294
-
295
-
296
-
297
-
298
-
299
-
300
-
301
-
302
-
303
-
304
-
305
-
306
-
307
-
308
-
309
-
310
-
311
-
312
-
313
-
314
-
315
-
316
-
317
-
318
-
319
-
320
-
321
-
322
-
323
-
324
-
325
-
326
-
327
-
328
-
329
-
330
-
331
-
332
-
333
-
334
-
335
-
336
-
337
-
338
-
339
-
340
-
341
-
342
-
343
-
344
-
345
-
346
-
347
-
348
-
349
-
350
-
351
-
352
-
353
-
354
-
355
-
356
-
357
-
358
-
359
-
360
-
361
-
362
-
363
-
364
-
365
-
366
-
367
-
368
-
369
-
370
-
371
-
372
-
373
-
374
-
375
-
376
-
377
-
378
-
379
-
380
-
381
-
382
-
383
-
384
-
385
-
386
-
387
-
388
-
389
-
390
-
391
-
392
-
393
-
394
-
395
-
396
 |
 |

161
Overview Operating & Financial Review Governance Financial Statements Shareholder Information
Europe
Hong
Kong
Rest of
Asia-
Pacific
North
America
Latin
America
Total
US$m US$m US$m US$m US$m US$m
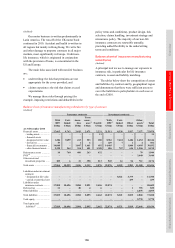
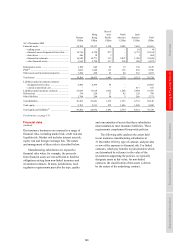
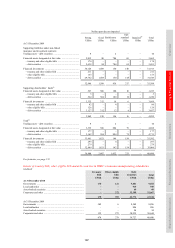
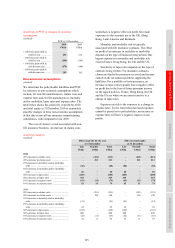
At 31 December 2009
Financial assets ................................................... 35,704 22,337 1,330 2,582 7,610 69,563
– trading assets ............................................... – – – – 10 10
– financial assets designated at fair value ...... 14,756 4,758 877 – 4,773 25,164
– derivatives ................................................... 446 18 3 – 1 468
– financial investments ................................... 16,940 14,771 133 2,037 1,968 35,849
– other financial assets ................................... 3,562 2,790 317 545 858 8,072
Reinsurance assets .............................................. 1,100 849 25 19 136 2,129
PVIF80 ................................................................. 1,022 1,248 113 138 259 2,780
Other assets and investment properties .............. 1,380 498 23 40 316 2,257
Total assets ......................................................... 39,206 24,932 1,491 2,779 8,321 76,729
Liabilities under investment contracts:
– designated at fair value ................................ 6,500 4,299 66 – – 10,865
– carried at amortised cost .............................. – – – – 417 417
Liabilities under insurance contracts .................. 27,845 17,618 1,072 1,268 5,904 53,707
Deferred tax ........................................................ 334 220 27 82 126 789
Other liabilities ................................................... 1,744 284 54 3 286 2,371
Total liabilities .................................................... 36,423 22,421 1,219 1,353 6,733 68,149
Total equity ......................................................... 2,783 2,511 272 1,426 1,588 8,580
Total equity and liabilities82 ............................... 39,206 24,932 1,491 2,779 8,321 76,729
For footnotes, see page 174.
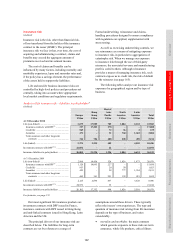
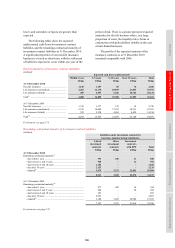
Financial risks
(Audited)
Our insurance businesses are exposed to a range of
financial risks, including market risk, credit risk and
liquidity risk. Market risk includes interest rate risk,
equity risk and foreign exchange risk. The nature
and management of these risks is described below.
Manufacturing subsidiaries are exposed to
financial risks when, for example, the proceeds
from financial assets are not sufficient to fund the
obligations arising from non-linked insurance and
investment contracts. In many jurisdictions, local
regulatory requirements prescribe the type, quality
and concentration of assets that these subsidiaries
must maintain to meet insurance liabilities. These
requirements complement Group-wide policies.
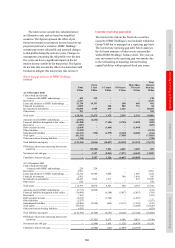
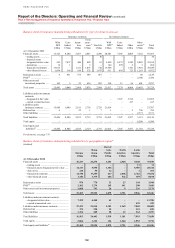
The following table analyses the assets held
in our insurance manufacturing subsidiaries at
31 December 2010 by type of contract, and provides
a view of the exposure to financial risk. For linked
contracts, which pay benefits to policyholders which
are determined by reference to the value of the
investments supporting the policies, we typically
designate assets at fair value; for non-linked
contracts, the classification of the assets is driven
by the nature of the underlying contract.