HSBC 2010 Annual Report Download - page 323
Download and view the complete annual report
Please find page 323 of the 2010 HSBC annual report below. You can navigate through the pages in the report by either clicking on the pages listed below, or by using the keyword search tool below to find specific information within the annual report.-
 1
1 -
2
-
3
-
4
-
5
-
6
-
7
-
8
-
9
-
10
-
11
-
12
-
13
-
14
-
15
-
16
-
17
-
18
-
19
-
20
-
21
-
22
-
23
-
24
-
25
-
26
-
27
-
28
-
29
-
30
-
31
-
32
-
33
-
34
-
35
-
36
-
37
-
38
-
39
-
40
-
41
-
42
-
43
-
44
-
45
-
46
-
47
-
48
-
49
-
50
-
51
-
52
-
53
-
54
-
55
-
56
-
57
-
58
-
59
-
60
-
61
-
62
-
63
-
64
-
65
-
66
-
67
-
68
-
69
-
70
-
71
-
72
-
73
-
74
-
75
-
76
-
77
-
78
-
79
-
80
-
81
-
82
-
83
-
84
-
85
-
86
-
87
-
88
-
89
-
90
-
91
-
92
-
93
-
94
-
95
-
96
-
97
-
98
-
99
-
100
-
101
-
102
-
103
-
104
-
105
-
106
-
107
-
108
-
109
-
110
-
111
-
112
-
113
-
114
-
115
-
116
-
117
-
118
-
119
-
120
-
121
-
122
-
123
-
124
-
125
-
126
-
127
-
128
-
129
-
130
-
131
-
132
-
133
-
134
-
135
-
136
-
137
-
138
-
139
-
140
-
141
-
142
-
143
-
144
-
145
-
146
-
147
-
148
-
149
-
150
-
151
-
152
-
153
-
154
-
155
-
156
-
157
-
158
-
159
-
160
-
161
-
162
-
163
-
164
-
165
-
166
-
167
-
168
-
169
-
170
-
171
-
172
-
173
-
174
-
175
-
176
-
177
-
178
-
179
-
180
-
181
-
182
-
183
-
184
-
185
-
186
-
187
-
188
-
189
-
190
-
191
-
192
-
193
-
194
-
195
-
196
-
197
-
198
-
199
-
200
-
201
-
202
-
203
-
204
-
205
-
206
-
207
-
208
-
209
-
210
-
211
-
212
-
213
-
214
-
215
-
216
-
217
-
218
-
219
-
220
-
221
-
222
-
223
-
224
-
225
-
226
-
227
-
228
-
229
-
230
-
231
-
232
-
233
-
234
-
235
-
236
-
237
-
238
-
239
-
240
-
241
-
242
-
243
-
244
-
245
-
246
-
247
-
248
-
249
-
250
-
251
-
252
-
253
-
254
-
255
-
256
-
257
-
258
-
259
-
260
-
261
-
262
-
263
-
264
-
265
-
266
-
267
-
268
-
269
-
270
-
271
-
272
-
273
-
274
-
275
-
276
-
277
-
278
-
279
-
280
-
281
-
282
-
283
-
284
-
285
-
286
-
287
-
288
-
289
-
290
-
291
-
292
-
293
-
294
-
295
-
296
-
297
-
298
-
299
-
300
-
301
-
302
-
303
-
304
-
305
-
306
-
307
-
308
-
309
-
310
-
311
-
312
-
 313
313 -
 314
314 -
 315
315 -
 316
316 -
 317
317 -
 318
318 -
 319
319 -
 320
320 -
 321
321 -
 322
322 -
 323
323 -
 324
324 -
 325
325 -
 326
326 -
 327
327 -
 328
328 -
 329
329 -
 330
330 -
 331
331 -
 332
332 -
 333
333 -
334
-
335
-
336
-
337
-
338
-
339
-
340
-
341
-
342
-
343
-
344
-
345
-
346
-
347
-
348
-
349
-
350
-
351
-
352
-
353
-
354
-
355
-
356
-
357
-
358
-
359
-
360
-
361
-
362
-
363
-
364
-
365
-
366
-
367
-
368
-
369
-
370
-
371
-
372
-
373
-
374
-
375
-
376
-
377
-
378
-
379
-
380
-
381
-
382
-
383
-
384
-
385
-
386
-
387
-
388
-
389
-
390
-
391
-
392
-
393
-
394
-
395
-
396
 |
 |
321
Overview Operating & Financial Review Governance Financial Statements Shareholder Information
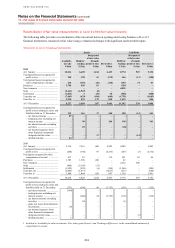
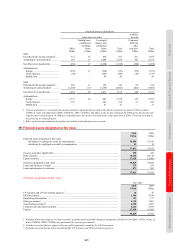
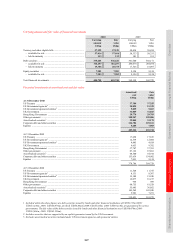
Financial assets reclassified to:
loans and receivables
available
for sale
ABSs
Trading loans
– commercial
mortgage
loans
Leveraged
finance and
syndicated
loans Total
Corporate
debt and
other
securities Total
US$m US$m US$m US$m US$m US$m
2009
Recorded in the income statement1 ... 511 32 434 977 101 1,078
Assuming no reclassification2 ............ 767 15 1,494 2,276 301 2,577
Net effect of reclassification .............. (256) 17 (1,060) (1,299) (200) (1,499)
Attributable to:
Europe ........................................... (212) 17 (566) (761) (170) (931)
North America ............................... (44) – (543) (587) (30) (617)
Middle East .................................... – – 49 49 – 49
2008
Recorded in the income statement1 ... 303 17 192 512 22 534
Assuming no reclassification2 ............ (1,549) (13) (1,239) (2,801) (202) (3,003)
Net effect of reclassification .............. 1,852 30 1,431 3,313 224 3,537
Attributable to:
Europe ........................................... 1,537 30 803 2,370 193 2,563
North America ............................... 315 – 601 916 31 947
Middle East .................................... – – 27 27 – 27
1 ‘Income and expense’ recorded in the income statement represents the accrual of the effective interest rate and, for 2010, includes
US$6m in respect of impairment (2009: US$163m; 2008: US$26m). The effect on the income statement for 2008 shows the income and
expense post-reclassification. In 2008 pre-reclassification, the assets were held at fair value and a loss of US$1,371m was recorded in
the period up to reclassification.
2 Effect on the income statement during the year had the reclassification not occurred.
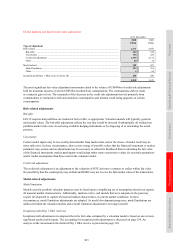
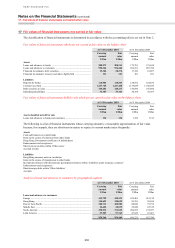
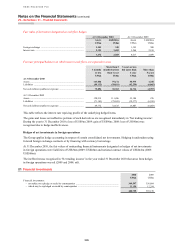
19 Financial assets designated at fair value
2010 2009
US$m US$m
Financial assets designated at fair value:
– not subject to repledge or resale by counterparties .......................................................................... 36,990 37,166
– which may be repledged or resold by counterparties ...................................................................... 21 15
37,011 37,181
Treasury and other eligible bills ............................................................................................................... 159 223
Debt securities .......................................................................................................................................... 18,248 20,718
Equity securities ....................................................................................................................................... 17,418 14,983
Securities designated at fair value ............................................................................................................ 35,825 35,924
Loans and advances to banks ................................................................................................................... 315 354
Loans and advances to customers ............................................................................................................ 871 903
37,011 37,181
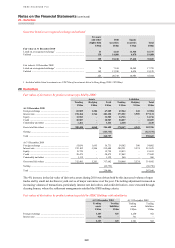
Securities designated at fair value
Fair value1
2010 2009
US$m US$m
US Treasury and US Government agencies2 ........................................................................................... 78 78
UK Government ....................................................................................................................................... 1,304 4,799
Hong Kong Government ......................................................................................................................... 151 177
Other government .................................................................................................................................... 4,130 3,491
Asset-backed securities3 .......................................................................................................................... 6,128 6,463
Corporate debt and other securities ......................................................................................................... 6,616 5,933
Equities .................................................................................................................................................... 17,418 14,983
35,825 35,924
1 Included within these figures are debt securities issued by banks and other financial institutions of US$10,185m (2009: US$13,745m), of
which US$48m (2009: US$49m) are guaranteed by various governments.
2 Includes securities that are supported by an explicit guarantee issued by the US Government.
3 Excludes asset-backed securities included under US Treasury and US Government agencies.