HSBC 2010 Annual Report Download - page 76
Download and view the complete annual report
Please find page 76 of the 2010 HSBC annual report below. You can navigate through the pages in the report by either clicking on the pages listed below, or by using the keyword search tool below to find specific information within the annual report.-
 1
1 -
2
-
3
-
4
-
5
-
6
-
7
-
8
-
9
-
10
-
11
-
12
-
13
-
14
-
15
-
16
-
17
-
18
-
19
-
20
-
21
-
22
-
23
-
24
-
25
-
26
-
27
-
28
-
29
-
30
-
31
-
32
-
33
-
34
-
35
-
36
-
37
-
38
-
39
-
40
-
41
-
42
-
43
-
44
-
45
-
46
-
47
-
48
-
49
-
50
-
51
-
52
-
53
-
54
-
55
-
56
-
57
-
58
-
59
-
60
-
61
-
62
-
63
-
64
-
65
-
 66
66 -
 67
67 -
 68
68 -
 69
69 -
 70
70 -
 71
71 -
 72
72 -
 73
73 -
 74
74 -
 75
75 -
 76
76 -
 77
77 -
 78
78 -
 79
79 -
 80
80 -
 81
81 -
 82
82 -
 83
83 -
 84
84 -
 85
85 -
 86
86 -
87
-
88
-
89
-
90
-
91
-
92
-
93
-
94
-
95
-
96
-
97
-
98
-
99
-
100
-
101
-
102
-
103
-
104
-
105
-
106
-
107
-
108
-
109
-
110
-
111
-
112
-
113
-
114
-
115
-
116
-
117
-
118
-
119
-
120
-
121
-
122
-
123
-
124
-
125
-
126
-
127
-
128
-
129
-
130
-
131
-
132
-
133
-
134
-
135
-
136
-
137
-
138
-
139
-
140
-
141
-
142
-
143
-
144
-
145
-
146
-
147
-
148
-
149
-
150
-
151
-
152
-
153
-
154
-
155
-
156
-
157
-
158
-
159
-
160
-
161
-
162
-
163
-
164
-
165
-
166
-
167
-
168
-
169
-
170
-
171
-
172
-
173
-
174
-
175
-
176
-
177
-
178
-
179
-
180
-
181
-
182
-
183
-
184
-
185
-
186
-
187
-
188
-
189
-
190
-
191
-
192
-
193
-
194
-
195
-
196
-
197
-
198
-
199
-
200
-
201
-
202
-
203
-
204
-
205
-
206
-
207
-
208
-
209
-
210
-
211
-
212
-
213
-
214
-
215
-
216
-
217
-
218
-
219
-
220
-
221
-
222
-
223
-
224
-
225
-
226
-
227
-
228
-
229
-
230
-
231
-
232
-
233
-
234
-
235
-
236
-
237
-
238
-
239
-
240
-
241
-
242
-
243
-
244
-
245
-
246
-
247
-
248
-
249
-
250
-
251
-
252
-
253
-
254
-
255
-
256
-
257
-
258
-
259
-
260
-
261
-
262
-
263
-
264
-
265
-
266
-
267
-
268
-
269
-
270
-
271
-
272
-
273
-
274
-
275
-
276
-
277
-
278
-
279
-
280
-
281
-
282
-
283
-
284
-
285
-
286
-
287
-
288
-
289
-
290
-
291
-
292
-
293
-
294
-
295
-
296
-
297
-
298
-
299
-
300
-
301
-
302
-
303
-
304
-
305
-
306
-
307
-
308
-
309
-
310
-
311
-
312
-
313
-
314
-
315
-
316
-
317
-
318
-
319
-
320
-
321
-
322
-
323
-
324
-
325
-
326
-
327
-
328
-
329
-
330
-
331
-
332
-
333
-
334
-
335
-
336
-
337
-
338
-
339
-
340
-
341
-
342
-
343
-
344
-
345
-
346
-
347
-
348
-
349
-
350
-
351
-
352
-
353
-
354
-
355
-
356
-
357
-
358
-
359
-
360
-
361
-
362
-
363
-
364
-
365
-
366
-
367
-
368
-
369
-
370
-
371
-
372
-
373
-
374
-
375
-
376
-
377
-
378
-
379
-
380
-
381
-
382
-
383
-
384
-
385
-
386
-
387
-
388
-
389
-
390
-
391
-
392
-
393
-
394
-
395
-
396
 |
 |

HSBC HOLDINGS PLC
Report of the Directors: Operating and Financial Review (continued)
Geographical regions > North America
74
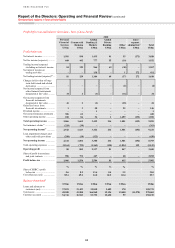
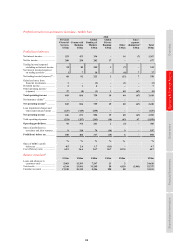
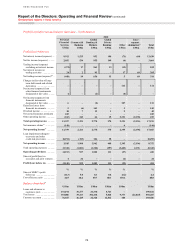
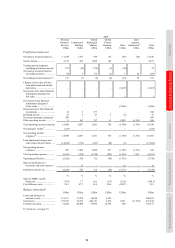
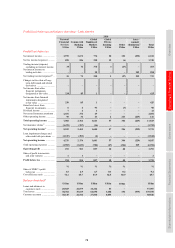
Profit/(loss) before tax and balance sheet data – North America
2010
Personal
Financial
Services
US$m
Commercial
Banking
US$m
Global
Banking &
Markets
US$m
Global
Private
Banking
US$m
Other
US$m
Inter-
segment
elimination56
US$m
Total
US$m
Profit/(loss) before tax
Net interest income/(expense) .... 9,912 1,525 952 190 (71) (69) 12,439
Net fee income/(expense) ........... 2,032 534 955 149 (6) – 3,664
Trading income/(expense)
excluding net interest income (472) 17 563 13 (12) – 109
Net interest income on
trading activities ..................... 24 2 93 –17 69 205
Net trading income/(expense)49 .. (448) 19 656 13 5 69 314
Changes in fair value of long-
term debt issued and related
derivatives .............................. – – – – 111 – 111
Net income/(expense) from
other financial instruments
designated at fair value ........... 6 – (2) –(4) – –
Net income/(expense) from
financial instruments
designated at fair value ........... 6 – (2) – 107 – 111
Gains less losses from
financial investments .............. 5 (6) 141 – 3 – 143
Dividend income ......................... 18 7 12 3 2 – 42
Net earned insurance premiums . 245 – – – – – 245
Other operating income .............. (243) 242 64 15 2,351 (2,196) 233
Total operating income ............ 11,527 2,321 2,778 370 2,391 (2,196) 17,191
Net insurance claims57 ................ (148) – – – 4 – (144)
Net operating income46 ............. 11,379 2,321 2,778 370 2,395 (2,196) 17,047
Loan impairment (charges)/
recoveries and other
credit risk provisions .............. (8,194) (323) 184 38 – – (8,295)
Net operating income ............... 3,185 1,998 2,962 408 2,395 (2,196) 8,752
Total operating expenses ............ (5,338) (1,081) (1,380) (297) (2,422) 2,196 (8,322)
Operating profit/(loss) .............. (2,153) 917 1,582 111 (27) – 430
Share of profit/(loss) in
associates and joint ventures .. 4 22 – – (2) – 24
Profit/(loss) before tax .............. (2,149) 939 1,582 111 (29) – 454
% % % %
%
%
Share of HSBC’s profit
before tax ................................ (11.3) 5.0 8.3 0.6 (0.2) 2.4
Cost efficiency ratio ................... 46.9 46.6 49.7 80.3 101.1 48.8
Balance sheet data45
US$m US$m US$m US$m US$m US$m
Loans and advances to
customers (net) ....................... 131,194 30,277 24,338 4,723 – 190,532
Total assets ................................. 154,086 39,213 306,416 5,824 9,373 (22,425) 492,487
Customer accounts ...................... 76,817 46,425 22,324 12,812 108 158,486