HSBC 2010 Annual Report Download - page 44
Download and view the complete annual report
Please find page 44 of the 2010 HSBC annual report below. You can navigate through the pages in the report by either clicking on the pages listed below, or by using the keyword search tool below to find specific information within the annual report.-
 1
1 -
2
-
3
-
4
-
5
-
6
-
7
-
8
-
9
-
10
-
11
-
12
-
13
-
14
-
15
-
16
-
17
-
18
-
19
-
20
-
21
-
22
-
23
-
24
-
25
-
26
-
27
-
28
-
29
-
30
-
31
-
32
-
33
-
 34
34 -
 35
35 -
 36
36 -
 37
37 -
 38
38 -
 39
39 -
 40
40 -
 41
41 -
 42
42 -
 43
43 -
 44
44 -
 45
45 -
 46
46 -
 47
47 -
 48
48 -
 49
49 -
 50
50 -
 51
51 -
 52
52 -
 53
53 -
 54
54 -
55
-
56
-
57
-
58
-
59
-
60
-
61
-
62
-
63
-
64
-
65
-
66
-
67
-
68
-
69
-
70
-
71
-
72
-
73
-
74
-
75
-
76
-
77
-
78
-
79
-
80
-
81
-
82
-
83
-
84
-
85
-
86
-
87
-
88
-
89
-
90
-
91
-
92
-
93
-
94
-
95
-
96
-
97
-
98
-
99
-
100
-
101
-
102
-
103
-
104
-
105
-
106
-
107
-
108
-
109
-
110
-
111
-
112
-
113
-
114
-
115
-
116
-
117
-
118
-
119
-
120
-
121
-
122
-
123
-
124
-
125
-
126
-
127
-
128
-
129
-
130
-
131
-
132
-
133
-
134
-
135
-
136
-
137
-
138
-
139
-
140
-
141
-
142
-
143
-
144
-
145
-
146
-
147
-
148
-
149
-
150
-
151
-
152
-
153
-
154
-
155
-
156
-
157
-
158
-
159
-
160
-
161
-
162
-
163
-
164
-
165
-
166
-
167
-
168
-
169
-
170
-
171
-
172
-
173
-
174
-
175
-
176
-
177
-
178
-
179
-
180
-
181
-
182
-
183
-
184
-
185
-
186
-
187
-
188
-
189
-
190
-
191
-
192
-
193
-
194
-
195
-
196
-
197
-
198
-
199
-
200
-
201
-
202
-
203
-
204
-
205
-
206
-
207
-
208
-
209
-
210
-
211
-
212
-
213
-
214
-
215
-
216
-
217
-
218
-
219
-
220
-
221
-
222
-
223
-
224
-
225
-
226
-
227
-
228
-
229
-
230
-
231
-
232
-
233
-
234
-
235
-
236
-
237
-
238
-
239
-
240
-
241
-
242
-
243
-
244
-
245
-
246
-
247
-
248
-
249
-
250
-
251
-
252
-
253
-
254
-
255
-
256
-
257
-
258
-
259
-
260
-
261
-
262
-
263
-
264
-
265
-
266
-
267
-
268
-
269
-
270
-
271
-
272
-
273
-
274
-
275
-
276
-
277
-
278
-
279
-
280
-
281
-
282
-
283
-
284
-
285
-
286
-
287
-
288
-
289
-
290
-
291
-
292
-
293
-
294
-
295
-
296
-
297
-
298
-
299
-
300
-
301
-
302
-
303
-
304
-
305
-
306
-
307
-
308
-
309
-
310
-
311
-
312
-
313
-
314
-
315
-
316
-
317
-
318
-
319
-
320
-
321
-
322
-
323
-
324
-
325
-
326
-
327
-
328
-
329
-
330
-
331
-
332
-
333
-
334
-
335
-
336
-
337
-
338
-
339
-
340
-
341
-
342
-
343
-
344
-
345
-
346
-
347
-
348
-
349
-
350
-
351
-
352
-
353
-
354
-
355
-
356
-
357
-
358
-
359
-
360
-
361
-
362
-
363
-
364
-
365
-
366
-
367
-
368
-
369
-
370
-
371
-
372
-
373
-
374
-
375
-
376
-
377
-
378
-
379
-
380
-
381
-
382
-
383
-
384
-
385
-
386
-
387
-
388
-
389
-
390
-
391
-
392
-
393
-
394
-
395
-
396
 |
 |
HSBC HOLDINGS PLC
Report of the Directors: Operating and Financial Review (continued)
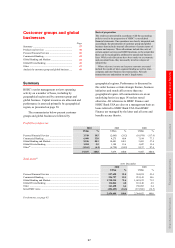
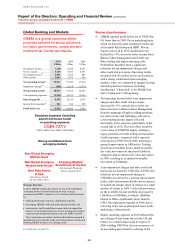
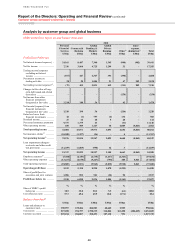
Customer groups and global businesses > CMB
42
Commercial Banking
CMB offers a full range of commercial
financial services and tailored
propositions to 3.6m customers
ranging from sole proprietors to
publicly quoted companies in 65
countries.
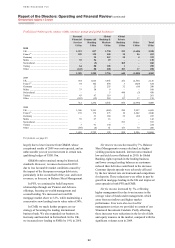
2010 2009 2008
US$m US$m US$m
Net interest income ........... 8,487 7,883 9,494
Net fee income .................. 3,964 3,702 4,097
Other income .................... 1,383 1,268 1,726
Net operating income46 ... 13,834 12,853 15,317
Impairment charges47 ........ (1,805) (3,282) (2,173)
Net operating income ..... 12,029 9,571 13,144
Total operating expenses .. (6,831) (5,963) (6,581)
Operating profit .............. 5,198 3,608 6,563
Income from associates48 .. 892 667 631
Profit before tax .............. 6,090 4,275 7,194
Strong balance sheet growth with
21%
rise in lending to US$239bn
Significant pre-tax profit
contribution from
emerging markets at
67%
First international bank to
complete renminbi trade
settlements across six continents
Strategic direction
CMB’s core strategy is focused on two key initiatives:
• to be the leading international business bank in all our markets,
leveraging HSBC’s extensive geographical network together
with its product expertise in payments, trade, receivables
finance and foreign exchange to actively support customers who
are trading and investing internationally; and
• to be the best bank for small- and medium-sized enterprises in
our largest markets.
For footnotes, see page 83.
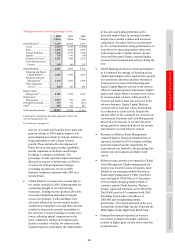
Review of performance
• In 2010, CMB reported profit before tax of
US$6.1bn, 42% higher than in 2009 with growth
across all regions. Excluding the gains from the
sales in 2010 of HSBC Insurance Brokers and
our stake in the Wells Fargo HSBC Trade Bank,
and similar non-recurring items in 2009, (see
page 14), profit before tax increased by 48%.
The rise in profit reflected an improvement in
the credit environment and strong growth in
world trade.
• Revenue grew by 8% to US$13.7bn, mainly in
Asia, where we expanded customer lending
significantly and increased our fee income
from remittances, trade and investments. Our
insurance operations also performed strongly
in Asia, with an increased uptake of our life
insurance products in Hong Kong. In North
America, repricing initiatives led to a notable
increase in revenue.
• Loan impairment charges and other credit risk
provisions declined by 46% to US$1.8bn with
favourable variances in all regions as the credit
environment improved and our exposure to
higher risk portfolios was managed down.
• Excluding CMB’s share of the non-recurring
accounting gains related to the change in the UK
pension scheme, (see page 26), operating
expenses increased by 11% to US$6.8bn as we
continued to invest for future revenue growth
in those markets that we see as central
to international connectivity. We hired more
relationship managers in France, Brazil, Mexico
and Hong Kong, and continued to invest in
systems to improve our customer experience.
As a result, our cost efficiency ratio rose to
49.8% in 2010.
• CMB’s share of income from associates grew
by 33% to US$892m, notably in mainland
China.
• Customer lending balances rose by 21% to
US$239bn, driven by increased demand in Asia
as market sentiment improved, and growth in
key developed markets such as France and the
UK, where we actively supported corporates and
SMEs in response to changes in the economy.
Our corporate segment increased lending by
25% to US$183bn, notably in Hong Kong and
mainland China.
• CMB attracted over half a million new
customers in 2010, taking the total to 3.6m, and
we grew customer account balances by 8%, with
significant growth in Asia where HSBC was