HSBC 2010 Annual Report Download - page 337
Download and view the complete annual report
Please find page 337 of the 2010 HSBC annual report below. You can navigate through the pages in the report by either clicking on the pages listed below, or by using the keyword search tool below to find specific information within the annual report.-
 1
1 -
2
-
3
-
4
-
5
-
6
-
7
-
8
-
9
-
10
-
11
-
12
-
13
-
14
-
15
-
16
-
17
-
18
-
19
-
20
-
21
-
22
-
23
-
24
-
25
-
26
-
27
-
28
-
29
-
30
-
31
-
32
-
33
-
34
-
35
-
36
-
37
-
38
-
39
-
40
-
41
-
42
-
43
-
44
-
45
-
46
-
47
-
48
-
49
-
50
-
51
-
52
-
53
-
54
-
55
-
56
-
57
-
58
-
59
-
60
-
61
-
62
-
63
-
64
-
65
-
66
-
67
-
68
-
69
-
70
-
71
-
72
-
73
-
74
-
75
-
76
-
77
-
78
-
79
-
80
-
81
-
82
-
83
-
84
-
85
-
86
-
87
-
88
-
89
-
90
-
91
-
92
-
93
-
94
-
95
-
96
-
97
-
98
-
99
-
100
-
101
-
102
-
103
-
104
-
105
-
106
-
107
-
108
-
109
-
110
-
111
-
112
-
113
-
114
-
115
-
116
-
117
-
118
-
119
-
120
-
121
-
122
-
123
-
124
-
125
-
126
-
127
-
128
-
129
-
130
-
131
-
132
-
133
-
134
-
135
-
136
-
137
-
138
-
139
-
140
-
141
-
142
-
143
-
144
-
145
-
146
-
147
-
148
-
149
-
150
-
151
-
152
-
153
-
154
-
155
-
156
-
157
-
158
-
159
-
160
-
161
-
162
-
163
-
164
-
165
-
166
-
167
-
168
-
169
-
170
-
171
-
172
-
173
-
174
-
175
-
176
-
177
-
178
-
179
-
180
-
181
-
182
-
183
-
184
-
185
-
186
-
187
-
188
-
189
-
190
-
191
-
192
-
193
-
194
-
195
-
196
-
197
-
198
-
199
-
200
-
201
-
202
-
203
-
204
-
205
-
206
-
207
-
208
-
209
-
210
-
211
-
212
-
213
-
214
-
215
-
216
-
217
-
218
-
219
-
220
-
221
-
222
-
223
-
224
-
225
-
226
-
227
-
228
-
229
-
230
-
231
-
232
-
233
-
234
-
235
-
236
-
237
-
238
-
239
-
240
-
241
-
242
-
243
-
244
-
245
-
246
-
247
-
248
-
249
-
250
-
251
-
252
-
253
-
254
-
255
-
256
-
257
-
258
-
259
-
260
-
261
-
262
-
263
-
264
-
265
-
266
-
267
-
268
-
269
-
270
-
271
-
272
-
273
-
274
-
275
-
276
-
277
-
278
-
279
-
280
-
281
-
282
-
283
-
284
-
285
-
286
-
287
-
288
-
289
-
290
-
291
-
292
-
293
-
294
-
295
-
296
-
297
-
298
-
299
-
300
-
301
-
302
-
303
-
304
-
305
-
306
-
307
-
308
-
309
-
310
-
311
-
312
-
313
-
314
-
315
-
316
-
317
-
318
-
319
-
320
-
321
-
322
-
323
-
324
-
325
-
326
-
 327
327 -
 328
328 -
 329
329 -
 330
330 -
 331
331 -
 332
332 -
 333
333 -
 334
334 -
 335
335 -
 336
336 -
 337
337 -
 338
338 -
 339
339 -
 340
340 -
 341
341 -
 342
342 -
 343
343 -
 344
344 -
 345
345 -
 346
346 -
 347
347 -
348
-
349
-
350
-
351
-
352
-
353
-
354
-
355
-
356
-
357
-
358
-
359
-
360
-
361
-
362
-
363
-
364
-
365
-
366
-
367
-
368
-
369
-
370
-
371
-
372
-
373
-
374
-
375
-
376
-
377
-
378
-
379
-
380
-
381
-
382
-
383
-
384
-
385
-
386
-
387
-
388
-
389
-
390
-
391
-
392
-
393
-
394
-
395
-
396
 |
 |

335
Overview Operating & Financial Review Governance Financial Statements Shareholder Information
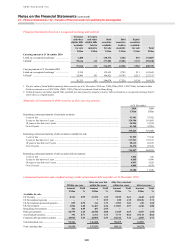
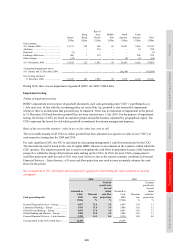
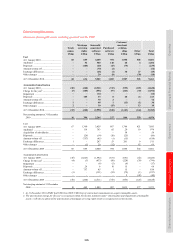
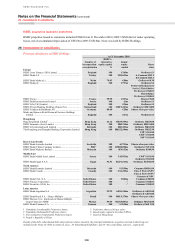
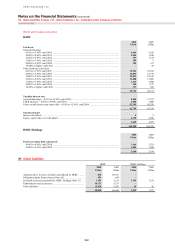
Other intangible assets
Movement of intangible assets excluding goodwill and the PVIF
Trade
names
Mortgage
servicing
rights
Internally
generated
software
Purchased
software
Customer/
merchant
relation-
ships Other Total
US$m US$m US$m US$m US$m US$m US$m
Cost
At 1 January 2010 ................................. 68 689 4,400 954 1,988 502 8,601
Additions1 ............................................. – 52 960 140 48 4 1,204
Disposals ............................................... – (105) (40) (15) (79) – (239)
Amount written off ............................... – – (70) (2) – – (72)
Exchange differences ............................ – – (68) (4) 30 27 (15)
Other changes ....................................... – – 20 (8) – (30) (18)
At 31 December 2010 ........................... 68 636 5,202 1,065 1,987 503 9,461
Accumulated amortisation
At 1 January 2010 ................................. (50) (240) (2,511) (747) (955) (125) (4,628)
Charge for the year2 .............................. (5) (105) (596) (97) (243) (30) (1,076)
Impairment ............................................ – – (12) – – – (12)
Disposals ............................................... – 105 33 8 68 (1) 213
Amount written off ............................... – – 70 2 – – 72
Exchange differences ............................ 1 – 48 1 (13) (1) 36
Other changes ....................................... 2 – 10 (15) – 13 10
At 31 December 2010 ........................... (52) (240) (2,958) (848) (1,143) (144) (5,385)
Net carrying amount at 31 December
2010 .................................................. 16 396 2,244 217 844 359 4,076
Cost
At 1 January 2009 ................................. 67 1,360 3,429 867 1,749 421 7,893
Additions1 ............................................. – 116 763 65 20 10 974
Acquisition of subsidiaries ................... – – – – 58 – 58
Disposals ............................................... – (29) (14) (18) (25) – (86)
Amount written off ............................... – (757) (45) (1) (15) – (818)
Exchange differences ............................ 1 – 247 53 201 9 511
Other changes ....................................... – (1) 20 (12) – 62 69
At 31 December 2009 ........................... 68 689 4,400 954 1,988 502 8,601
Accumulated amortisation
At 1 January 2009 ................................. (45) (1,023) (1,992) (631) (681) (52) (4,424)
Charge for the year2 .............................. (4) (3) (433) (98) (228) (30) (796)
Impairment ............................................ – – (6) (5) (6) – (17)
Disposals ............................................... – 29 6 18 15 – 68
Amount written off ............................... – 757 45 1 15 – 818
Exchange differences ............................ (1) – (131) (32) (72) (1) (237)
Other changes ....................................... – – – – 2 (42) (40)
At 31 December 2009 ........................... (50) (240) (2,511) (747) (955) (125) (4,628)
Net carrying amount at 31 December
2009 .................................................. 18 449 1,889 207 1,033 377 3,973
1 At 31 December 2010, HSBC had US$0.2m (2009: US$0.2m) of contractual commitments to acquire intangible assets.
2 The amortisation charge for the year is recognised within the income statement under ‘Amortisation and impairment of intangible
assets’, with the exception of the amortisation of mortgage servicing rights which is recognised in net fee income.