HSBC 2010 Annual Report Download - page 152
Download and view the complete annual report
Please find page 152 of the 2010 HSBC annual report below. You can navigate through the pages in the report by either clicking on the pages listed below, or by using the keyword search tool below to find specific information within the annual report.-
 1
1 -
2
-
3
-
4
-
5
-
6
-
7
-
8
-
9
-
10
-
11
-
12
-
13
-
14
-
15
-
16
-
17
-
18
-
19
-
20
-
21
-
22
-
23
-
24
-
25
-
26
-
27
-
28
-
29
-
30
-
31
-
32
-
33
-
34
-
35
-
36
-
37
-
38
-
39
-
40
-
41
-
42
-
43
-
44
-
45
-
46
-
47
-
48
-
49
-
50
-
51
-
52
-
53
-
54
-
55
-
56
-
57
-
58
-
59
-
60
-
61
-
62
-
63
-
64
-
65
-
66
-
67
-
68
-
69
-
70
-
71
-
72
-
73
-
74
-
75
-
76
-
77
-
78
-
79
-
80
-
81
-
82
-
83
-
84
-
85
-
86
-
87
-
88
-
89
-
90
-
91
-
92
-
93
-
94
-
95
-
96
-
97
-
98
-
99
-
100
-
101
-
102
-
103
-
104
-
105
-
106
-
107
-
108
-
109
-
110
-
111
-
112
-
113
-
114
-
115
-
116
-
117
-
118
-
119
-
120
-
121
-
122
-
123
-
124
-
125
-
126
-
127
-
128
-
129
-
130
-
131
-
132
-
133
-
134
-
135
-
136
-
137
-
138
-
139
-
140
-
141
-
 142
142 -
 143
143 -
 144
144 -
 145
145 -
 146
146 -
 147
147 -
 148
148 -
 149
149 -
 150
150 -
 151
151 -
 152
152 -
 153
153 -
 154
154 -
 155
155 -
 156
156 -
 157
157 -
 158
158 -
 159
159 -
 160
160 -
 161
161 -
 162
162 -
163
-
164
-
165
-
166
-
167
-
168
-
169
-
170
-
171
-
172
-
173
-
174
-
175
-
176
-
177
-
178
-
179
-
180
-
181
-
182
-
183
-
184
-
185
-
186
-
187
-
188
-
189
-
190
-
191
-
192
-
193
-
194
-
195
-
196
-
197
-
198
-
199
-
200
-
201
-
202
-
203
-
204
-
205
-
206
-
207
-
208
-
209
-
210
-
211
-
212
-
213
-
214
-
215
-
216
-
217
-
218
-
219
-
220
-
221
-
222
-
223
-
224
-
225
-
226
-
227
-
228
-
229
-
230
-
231
-
232
-
233
-
234
-
235
-
236
-
237
-
238
-
239
-
240
-
241
-
242
-
243
-
244
-
245
-
246
-
247
-
248
-
249
-
250
-
251
-
252
-
253
-
254
-
255
-
256
-
257
-
258
-
259
-
260
-
261
-
262
-
263
-
264
-
265
-
266
-
267
-
268
-
269
-
270
-
271
-
272
-
273
-
274
-
275
-
276
-
277
-
278
-
279
-
280
-
281
-
282
-
283
-
284
-
285
-
286
-
287
-
288
-
289
-
290
-
291
-
292
-
293
-
294
-
295
-
296
-
297
-
298
-
299
-
300
-
301
-
302
-
303
-
304
-
305
-
306
-
307
-
308
-
309
-
310
-
311
-
312
-
313
-
314
-
315
-
316
-
317
-
318
-
319
-
320
-
321
-
322
-
323
-
324
-
325
-
326
-
327
-
328
-
329
-
330
-
331
-
332
-
333
-
334
-
335
-
336
-
337
-
338
-
339
-
340
-
341
-
342
-
343
-
344
-
345
-
346
-
347
-
348
-
349
-
350
-
351
-
352
-
353
-
354
-
355
-
356
-
357
-
358
-
359
-
360
-
361
-
362
-
363
-
364
-
365
-
366
-
367
-
368
-
369
-
370
-
371
-
372
-
373
-
374
-
375
-
376
-
377
-
378
-
379
-
380
-
381
-
382
-
383
-
384
-
385
-
386
-
387
-
388
-
389
-
390
-
391
-
392
-
393
-
394
-
395
-
396
 |
 |

HSBC HOLDINGS PLC
Report of the Directors: Operating and Financial Review (continued)
Risk > Market risk > Sensitivity of NII / Defined benefit pension schemes
150
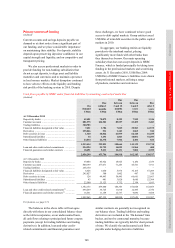
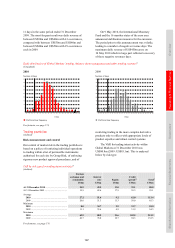
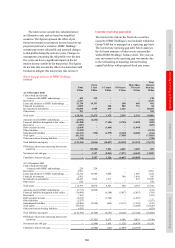
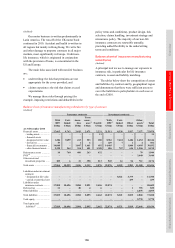
Assuming no management actions, a sequence of
such rises would increase planned net interest
income for 2011 by US$882m (2010: US$695m),
while a sequence of such falls would decrease
planned net interest income by US$1,525m
(2010: US$1,563m). These figures incorporate the
effect of any option features in the underlying
exposures.
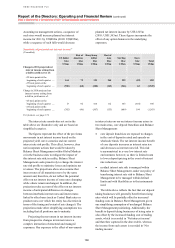
Sensitivity of projected net interest income73
(Unaudited)
US dollar
bloc
US$m
Rest of
Americas
bloc
US$m
Hong Kong
dollar
bloc
US$m
Rest of
Asia
bloc
US$m
Sterling
bloc
US$m
Euro
bloc
US$m
Total
US$m
Change in 2011 projected net
interest income arising from
a shift in yield curves of:
+25 basis points at the
beginning of each quarter ..... 164 72 191 245 292 (82) 882
–25 basis points at the
beginning of each quarter ..... (550) (68) (280) (143) (546) 62 (1,525)
Change in 2010 projected net
interest income arising from
a shift in yield curves of:
+25 basis points at the
beginning of each quarter ..... 13 92 416 112 363 (301) 695
–25 basis points at the
beginning of each quarter ..... (382) (46) (507) (133) (689) 194 (1,563)
For footnote, see page 174.
The interest rate sensitivities set out in the
table above are illustrative only and are based on
simplified scenarios.
The figures represent the effect of the pro forma
movements in net interest income based on the
projected yield curve scenarios and our current
interest rate risk profile. This effect, however, does
not incorporate actions that would be taken by
Balance Sheet Management within Global Markets
or in the business units to mitigate the impact of
this interest rate risk; in reality, Balance Sheet
Management seeks proactively to change the interest
rate risk profile to minimise losses and optimise net
revenues. The projections above also assume that
interest rates of all maturities move by the same
amount and, therefore, do not reflect the potential
effect on net interest income of some rates changing
while others remain unchanged. In addition, the
projections take account of the effect on net interest
income of anticipated differences in changes
between interbank interest rates and interest rates
linked to other bases (such as Central Bank rates or
product rates over which the entity has discretion in
terms of the timing and extent of rate changes). The
projections make other simplifying assumptions too,
including that all positions run to maturity.
Projecting the movement in net interest income
from prospective changes in interest rates is a
complex interaction of structural and managed
exposures. Our exposure to the effect of movements
in interest rates on our net interest income arises in
two main areas, core deposit franchises and Balance
Sheet Management:
• core deposit franchises are exposed to changes
in the cost of deposits raised and spreads on
wholesale funds. The net interest income benefit
of core deposits increases as interest rates rise
and decreases as interest rates fall. This risk
is asymmetrical in a very low interest rate
environment, however, as there is limited room
to lower deposit pricing in the event of interest
rate reductions; and
• residual interest rate risk is managed within
Balance Sheet Management, under our policy of
transferring interest rate risk to Balance Sheet
Management to be managed within defined
limits and with flexibility as to the instruments
used.
The table above reflects the fact that our deposit
taking businesses will generally benefit from rising
rates which will be partially offset by increased
funding costs in Balance Sheet Management given
our simplifying assumption of unchanged Balance
Sheet Management positioning. Additionally, the
benefit to deposit taking businesses of rising rates is
also offset by the increased funding cost of trading
assets, which is recorded in ‘Net interest income’
and therefore captured in the above table, whereas
the income from such assets is recorded in ‘Net
trading income’.