HSBC 2010 Annual Report Download - page 102
Download and view the complete annual report
Please find page 102 of the 2010 HSBC annual report below. You can navigate through the pages in the report by either clicking on the pages listed below, or by using the keyword search tool below to find specific information within the annual report.-
 1
1 -
2
-
3
-
4
-
5
-
6
-
7
-
8
-
9
-
10
-
11
-
12
-
13
-
14
-
15
-
16
-
17
-
18
-
19
-
20
-
21
-
22
-
23
-
24
-
25
-
26
-
27
-
28
-
29
-
30
-
31
-
32
-
33
-
34
-
35
-
36
-
37
-
38
-
39
-
40
-
41
-
42
-
43
-
44
-
45
-
46
-
47
-
48
-
49
-
50
-
51
-
52
-
53
-
54
-
55
-
56
-
57
-
58
-
59
-
60
-
61
-
62
-
63
-
64
-
65
-
66
-
67
-
68
-
69
-
70
-
71
-
72
-
73
-
74
-
75
-
76
-
77
-
78
-
79
-
80
-
81
-
82
-
83
-
84
-
85
-
86
-
87
-
88
-
89
-
90
-
91
-
 92
92 -
 93
93 -
 94
94 -
 95
95 -
 96
96 -
 97
97 -
 98
98 -
 99
99 -
 100
100 -
 101
101 -
 102
102 -
 103
103 -
 104
104 -
 105
105 -
 106
106 -
 107
107 -
 108
108 -
 109
109 -
 110
110 -
 111
111 -
 112
112 -
113
-
114
-
115
-
116
-
117
-
118
-
119
-
120
-
121
-
122
-
123
-
124
-
125
-
126
-
127
-
128
-
129
-
130
-
131
-
132
-
133
-
134
-
135
-
136
-
137
-
138
-
139
-
140
-
141
-
142
-
143
-
144
-
145
-
146
-
147
-
148
-
149
-
150
-
151
-
152
-
153
-
154
-
155
-
156
-
157
-
158
-
159
-
160
-
161
-
162
-
163
-
164
-
165
-
166
-
167
-
168
-
169
-
170
-
171
-
172
-
173
-
174
-
175
-
176
-
177
-
178
-
179
-
180
-
181
-
182
-
183
-
184
-
185
-
186
-
187
-
188
-
189
-
190
-
191
-
192
-
193
-
194
-
195
-
196
-
197
-
198
-
199
-
200
-
201
-
202
-
203
-
204
-
205
-
206
-
207
-
208
-
209
-
210
-
211
-
212
-
213
-
214
-
215
-
216
-
217
-
218
-
219
-
220
-
221
-
222
-
223
-
224
-
225
-
226
-
227
-
228
-
229
-
230
-
231
-
232
-
233
-
234
-
235
-
236
-
237
-
238
-
239
-
240
-
241
-
242
-
243
-
244
-
245
-
246
-
247
-
248
-
249
-
250
-
251
-
252
-
253
-
254
-
255
-
256
-
257
-
258
-
259
-
260
-
261
-
262
-
263
-
264
-
265
-
266
-
267
-
268
-
269
-
270
-
271
-
272
-
273
-
274
-
275
-
276
-
277
-
278
-
279
-
280
-
281
-
282
-
283
-
284
-
285
-
286
-
287
-
288
-
289
-
290
-
291
-
292
-
293
-
294
-
295
-
296
-
297
-
298
-
299
-
300
-
301
-
302
-
303
-
304
-
305
-
306
-
307
-
308
-
309
-
310
-
311
-
312
-
313
-
314
-
315
-
316
-
317
-
318
-
319
-
320
-
321
-
322
-
323
-
324
-
325
-
326
-
327
-
328
-
329
-
330
-
331
-
332
-
333
-
334
-
335
-
336
-
337
-
338
-
339
-
340
-
341
-
342
-
343
-
344
-
345
-
346
-
347
-
348
-
349
-
350
-
351
-
352
-
353
-
354
-
355
-
356
-
357
-
358
-
359
-
360
-
361
-
362
-
363
-
364
-
365
-
366
-
367
-
368
-
369
-
370
-
371
-
372
-
373
-
374
-
375
-
376
-
377
-
378
-
379
-
380
-
381
-
382
-
383
-
384
-
385
-
386
-
387
-
388
-
389
-
390
-
391
-
392
-
393
-
394
-
395
-
396
 |
 |

HSBC HOLDINGS PLC
Report of the Directors: Operating and Financial Review (continued)
Risk > Credit risk > Credit exposure
100
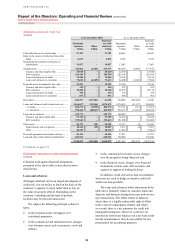
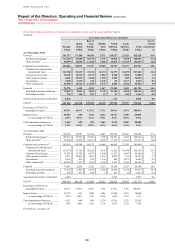
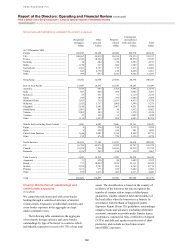
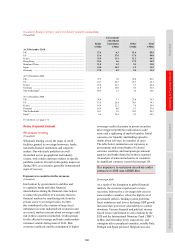
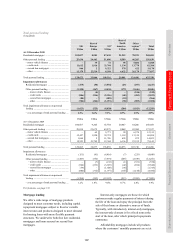
Gross loans and advances to customers by industry sector and by geographical region
(Audited)
Gross loans and advances to customers
Europe
Hong
Kong
Rest of
Asia-
Pacific
Middle
East
North
America
Latin
America Total
As a %
of total
gross loans
US$m US$m US$m US$m US$m US$m US$m %
At 31 December 2010
Personal .............................................. 161,717 57,308 40,184 5,371 139,117 21,623 425,320 43.4
Residential mortgages3 .................. 111,618 42,488 28,724 1,751 78,842 5,258 268,681 27.4
Other personal4 .............................. 50,099 14,820 11,460 3,620 60,275 16,365 156,639 16.0
Corporate and commercial ................ 203,804 80,823 67,247 19,560 38,707 35,371 445,512 45.6
Commercial, industrial and
international trade ..................... 111,980 33,451 41,274 11,173 16,737 23,079 237,694 24.3
Commercial real estate .................. 30,629 19,678 8,732 1,085 8,768 2,988 71,880 7.3
Other property-related ................... 6,401 15,232 5,426 1,785 5,109 885 34,838 3.6
Government ................................... 2,289 2,339 415 1,345 89 2,117 8,594 0.9
Other commercial5 ......................... 52,505 10,123 11,400 4,172 8,004 6,302 92,506 9.5
Financial ............................................ 70,725 3,189 2,259 1,347 21,202 3,003 101,725 10.4
Non-bank financial institutions ..... 70,019 2,824 2,058 1,335 21,109 2,818 100,163 10.2
Settlement accounts ....................... 706 365 201 12 93 185 1,562 0.2
Asset-backed securities reclassified .. 5,216 – – – 676 – 5,892 0.6
TGLAC6 ............................................. 441,462 141,320 109,690 26,278 199,702 59,997 978,449 100.0
Percentage of TGLAC by
geographical region ....................... 45.2% 14.4% 11.2% 2.7% 20.4% 6.1% 100.0%
Impaired loans ................................... 10,557 660 1,324 2,433 10,727 2,390 28,091
– as a percentage of TGLAC ......... 2.4% 0.5% 1.2% 9.3% 5.4% 4.0% 2.9%
Total impairment allowances ............ 5,663 629 959 1,652 9,170 2,010 20,083
– as a percentage of TGLAC ......... 1.3% 0.4% 0.9% 6.3% 4.6% 3.4% 2.1%
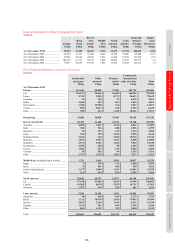
At 31 December 2009
Personal .............................................. 162,562 47,946 32,514 6,405 163,934 20,845 434,206 47.2
Residential mortgages3 .................. 109,872 35,292 21,983 1,898 86,591 5,033 260,669 28.3
Other personal4 .............................. 52,690 12,654 10,531 4,507 77,343 15,812 173,537 18.9
Corporate and commercial7 ............... 202,919 49,340 46,175 16,604 40,902 27,150 383,090 41.5
Commercial, industrial and
international trade ..................... 112,374 17,728 28,228 9,336 11,528 16,934 196,128 21.3
Commercial real estate .................. 33,853 13,782 6,475 1,309 11,527 2,443 69,389 7.5
Other property-related ................... 6,231 10,062 3,863 1,357 8,452 555 30,520 3.3
Government ................................... 2,216 441 595 1,356 208 1,873 6,689 0.7
Other commercial5 ......................... 48,245 7,327 7,014 3,246 9,187 5,345 80,364 8.7
Financial ............................................ 73,851 2,899 2,350 1,213 14,150 2,187 96,650 10.5
Non-bank financial institutions ..... 73,225 2,462 2,246 1,206 13,963 2,135 95,237 10.3
Settlement accounts ....................... 626 437 104 7 187 52 1,413 0.2
Asset-backed securities reclassified .. 6,284 – – – 1,543 – 7,827 0.8
TGLAC6 ............................................. 445,616 100,185 81,039 24,222 220,529 50,182 921,773 100.0
Percentage of TGLAC by
geographical region ....................... 48.3% 10.9% 8.8% 2.6% 23.9% 5.5% 100.0%
Impaired loans ................................... 10,722 841 1,200 1,646 13,246 2,951 30,606
– as a percentage of TGLAC ......... 2.4% 0.8% 1.5% 6.8% 6.0% 5.9% 3.3%
Total impairment allowances ............ 6,135 804 996 1,378 13,676 2,553 25,542
– as a percentage of TGLAC ......... 1.4% 0.8% 1.2% 5.7% 6.2% 5.1% 2.8%
For footnotes, see page 174.