HSBC 2010 Annual Report Download - page 176
Download and view the complete annual report
Please find page 176 of the 2010 HSBC annual report below. You can navigate through the pages in the report by either clicking on the pages listed below, or by using the keyword search tool below to find specific information within the annual report.-
 1
1 -
2
-
3
-
4
-
5
-
6
-
7
-
8
-
9
-
10
-
11
-
12
-
13
-
14
-
15
-
16
-
17
-
18
-
19
-
20
-
21
-
22
-
23
-
24
-
25
-
26
-
27
-
28
-
29
-
30
-
31
-
32
-
33
-
34
-
35
-
36
-
37
-
38
-
39
-
40
-
41
-
42
-
43
-
44
-
45
-
46
-
47
-
48
-
49
-
50
-
51
-
52
-
53
-
54
-
55
-
56
-
57
-
58
-
59
-
60
-
61
-
62
-
63
-
64
-
65
-
66
-
67
-
68
-
69
-
70
-
71
-
72
-
73
-
74
-
75
-
76
-
77
-
78
-
79
-
80
-
81
-
82
-
83
-
84
-
85
-
86
-
87
-
88
-
89
-
90
-
91
-
92
-
93
-
94
-
95
-
96
-
97
-
98
-
99
-
100
-
101
-
102
-
103
-
104
-
105
-
106
-
107
-
108
-
109
-
110
-
111
-
112
-
113
-
114
-
115
-
116
-
117
-
118
-
119
-
120
-
121
-
122
-
123
-
124
-
125
-
126
-
127
-
128
-
129
-
130
-
131
-
132
-
133
-
134
-
135
-
136
-
137
-
138
-
139
-
140
-
141
-
142
-
143
-
144
-
145
-
146
-
147
-
148
-
149
-
150
-
151
-
152
-
153
-
154
-
155
-
156
-
157
-
158
-
159
-
160
-
161
-
162
-
163
-
164
-
165
-
 166
166 -
 167
167 -
 168
168 -
 169
169 -
 170
170 -
 171
171 -
 172
172 -
 173
173 -
 174
174 -
 175
175 -
 176
176 -
 177
177 -
 178
178 -
 179
179 -
 180
180 -
 181
181 -
 182
182 -
 183
183 -
 184
184 -
 185
185 -
 186
186 -
187
-
188
-
189
-
190
-
191
-
192
-
193
-
194
-
195
-
196
-
197
-
198
-
199
-
200
-
201
-
202
-
203
-
204
-
205
-
206
-
207
-
208
-
209
-
210
-
211
-
212
-
213
-
214
-
215
-
216
-
217
-
218
-
219
-
220
-
221
-
222
-
223
-
224
-
225
-
226
-
227
-
228
-
229
-
230
-
231
-
232
-
233
-
234
-
235
-
236
-
237
-
238
-
239
-
240
-
241
-
242
-
243
-
244
-
245
-
246
-
247
-
248
-
249
-
250
-
251
-
252
-
253
-
254
-
255
-
256
-
257
-
258
-
259
-
260
-
261
-
262
-
263
-
264
-
265
-
266
-
267
-
268
-
269
-
270
-
271
-
272
-
273
-
274
-
275
-
276
-
277
-
278
-
279
-
280
-
281
-
282
-
283
-
284
-
285
-
286
-
287
-
288
-
289
-
290
-
291
-
292
-
293
-
294
-
295
-
296
-
297
-
298
-
299
-
300
-
301
-
302
-
303
-
304
-
305
-
306
-
307
-
308
-
309
-
310
-
311
-
312
-
313
-
314
-
315
-
316
-
317
-
318
-
319
-
320
-
321
-
322
-
323
-
324
-
325
-
326
-
327
-
328
-
329
-
330
-
331
-
332
-
333
-
334
-
335
-
336
-
337
-
338
-
339
-
340
-
341
-
342
-
343
-
344
-
345
-
346
-
347
-
348
-
349
-
350
-
351
-
352
-
353
-
354
-
355
-
356
-
357
-
358
-
359
-
360
-
361
-
362
-
363
-
364
-
365
-
366
-
367
-
368
-
369
-
370
-
371
-
372
-
373
-
374
-
375
-
376
-
377
-
378
-
379
-
380
-
381
-
382
-
383
-
384
-
385
-
386
-
387
-
388
-
389
-
390
-
391
-
392
-
393
-
394
-
395
-
396
 |
 |

HSBC HOLDINGS PLC
Report of the Directors: Operating and Financial Review (continued)
Risk > Other material risks > Residual value risk // Footnotes to Risk
174
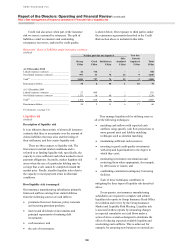
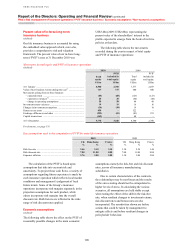
Residual value risk
(Unaudited)
A significant part of a lessor’s return from operating
leases is dependent upon its management of residual
value risk. This arises from operating lease
transactions to the extent that the values recovered
from disposing of leased assets or re-letting them at
the end of the lease terms (the ‘residual values’)
differ from those projected at the inception of the
leases.
The sale of our rail finance business ‘Eversholt
Rail Group’ during the year has significantly
reduced our exposure to residual value risk.
Footnotes to Risk
Credit risk
1 The amount of the loan commitments reflects, where relevant, the expected level of take-up of pre-approved loan offers made by
mailshots to personal customers. In addition to those amounts, there is a further maximum possible exposure to credit risk of
US$220.2bn (2009: US$62.3bn), reflecting the full take-up of such irrevocable loan commitments. The take-up of such offers is
generally at modest levels.
2 A change in the write-off period in North America during 2009 resulted in an acceleration of write-offs which reduced residential
mortgages by US$1.9bn, other personal loans by US$1.3bn and total personal lending by US$3.3bn, with a corresponding reduction in
impairment allowances. There was no significant effect on net loans and advances or loan impairment charges.
3 Residential mortgages include Hong Kong Government Home Ownership Scheme loans of US$3.5bn at 31 December 2010
(2009: US$3.5bn). Where disclosed, earlier comparatives were 2008: US$3.9bn; 2007: US$3.9bn; 2006: US$4.1bn.
4 Other personal loans and advances include second lien mortgages and other property-related lending.
5 Other commercial loans and advances include advances in respect of agriculture, transport, energy and utilities.
6 Included within ‘Total gross loans and advances to customers’ (‘TGLAC’) is credit card lending of US$62bn (2009: US$68bn).
Where disclosed, earlier comparatives were 2008: US$75bn; 2007: US$83bn; 2006: US$75bn.
7 The above numbers for North America include a reclassification within the corporate and commercial lending category to reflect a
more accurate presentation of lending in the region.
8 The impairment allowances on loans and advances to banks relate to the geographical regions, Europe, Middle East and North
America.
9 These balances were between 0.75% and 1% of total assets. All other balances were above 1%.
10 We do not have material retail exposures in any of the eurozone countries listed in this table.
11 Includes balances at central banks. Lending to banks comprises non-trading loans and advances to banks including reverse repurchase
transactions.
12 Derivative assets net of collateral and derivative liabilities for which a legally enforceable right of offset exists.
13 Includes residential mortgages of HSBC Bank USA and HSBC Finance.
14 Comprising Hong Kong, Rest of Asia-Pacific, Middle East and Latin America.
15 Negative equity arises when the value of the property used to secure a loan is below the balance outstanding on the loan, generally
based on values at the balance sheet date.
16 Loan-to-value ratios are generally based on values at the balance sheet date.
17 HSBC Finance lending is shown on a management basis and includes loans transferred to HSBC USA Inc. which are managed by
HSBC Finance.
18 Interest-only (affordability mortgages) are loans which are classified as ‘interest only’ for initial period before reverting to repayment.
As a consequence, in the table ‘Mortgage lending products’ on page 109 these balances are included in the category ‘Affordability
mortgages, including ARMs’.
19 Stated income lending forms a subset of total mortgage services lending across all categories.
20 By states which individually account for 5% or more of HSBC Finance’s US customer loan portfolio.
21 The average loss on sale of foreclosed properties is calculated as cash proceeds after deducting selling costs, commissions and other
ancillary costs, minus the book value of the property when it was moved to assets held for sale, divided by the book value of the
property when it was moved to assets held for sale.
22 The average total loss on foreclosed properties sold includes both the loss on sale (see footnote 21) and the cumulative write-downs
recognised on the loans up to and upon classification as assets held for sale. This average total loss on foreclosed properties is
expressed as a percentage of the book value of the property prior to its transfer to assets held for sale.
23 Percentages are expressed as a function of the relevant loans and receivables balance.
24 At 31 December 2010 and 2009, real estate secured delinquency included US$4.2bn and US$3.3bn, respectively, of loans that we
carried at the lower of cost on net realisable value.
25 We observe the disclosure convention that, in addition to those classified as EL9 to EL10, retail accounts classified EL1 to EL8 that are
delinquent by 90 days or more are considered impaired, unless individually they have been assessed as not impaired (see page 117,
‘Past due but not impaired gross financial instruments’).
26 The EL percentage is derived through a combination of PD and LGD, and may exceed 100% in circumstances where the LGD is above
100% reflecting the cost of recoveries.
27 Impairment allowances are not reported for financial instruments whereby the carrying amount is reduced directly for impairment and
not through the use of an allowance account.
28 Impairment is not measured for assets held in trading portfolios or designated at fair value as assets in such portfolios are managed
according to movements in fair value, and the fair value movement is taken directly to the income statement. Consequently, we report
all such balances under ‘Neither past due nor impaired’.
29 Loans and advances to customers includes asset-backed securities that have been externally rated as strong (2010: US$4.1bn; 2009:
US$5.7bn), good (2010: US$627m; 2009: US$881m), satisfactory (2010: US$452m; 2009: US$311m), sub-standard (2010: US$669m;
2009: US$468m) and impaired (2010: US$29m; 2009: US$460m).
30 Impaired loans and advances are those classified as CRR 9, CRR 10, EL 9 or EL 10 and all retail loans 90 days or more past due,
unless individually they have been assessed as not impaired (see page 117, ‘Past due but not impaired gross financial instruments’).