HSBC 2010 Annual Report Download - page 145
Download and view the complete annual report
Please find page 145 of the 2010 HSBC annual report below. You can navigate through the pages in the report by either clicking on the pages listed below, or by using the keyword search tool below to find specific information within the annual report.-
 1
1 -
2
-
3
-
4
-
5
-
6
-
7
-
8
-
9
-
10
-
11
-
12
-
13
-
14
-
15
-
16
-
17
-
18
-
19
-
20
-
21
-
22
-
23
-
24
-
25
-
26
-
27
-
28
-
29
-
30
-
31
-
32
-
33
-
34
-
35
-
36
-
37
-
38
-
39
-
40
-
41
-
42
-
43
-
44
-
45
-
46
-
47
-
48
-
49
-
50
-
51
-
52
-
53
-
54
-
55
-
56
-
57
-
58
-
59
-
60
-
61
-
62
-
63
-
64
-
65
-
66
-
67
-
68
-
69
-
70
-
71
-
72
-
73
-
74
-
75
-
76
-
77
-
78
-
79
-
80
-
81
-
82
-
83
-
84
-
85
-
86
-
87
-
88
-
89
-
90
-
91
-
92
-
93
-
94
-
95
-
96
-
97
-
98
-
99
-
100
-
101
-
102
-
103
-
104
-
105
-
106
-
107
-
108
-
109
-
110
-
111
-
112
-
113
-
114
-
115
-
116
-
117
-
118
-
119
-
120
-
121
-
122
-
123
-
124
-
125
-
126
-
127
-
128
-
129
-
130
-
131
-
132
-
133
-
134
-
 135
135 -
 136
136 -
 137
137 -
 138
138 -
 139
139 -
 140
140 -
 141
141 -
 142
142 -
 143
143 -
 144
144 -
 145
145 -
 146
146 -
 147
147 -
 148
148 -
 149
149 -
 150
150 -
 151
151 -
 152
152 -
 153
153 -
 154
154 -
 155
155 -
156
-
157
-
158
-
159
-
160
-
161
-
162
-
163
-
164
-
165
-
166
-
167
-
168
-
169
-
170
-
171
-
172
-
173
-
174
-
175
-
176
-
177
-
178
-
179
-
180
-
181
-
182
-
183
-
184
-
185
-
186
-
187
-
188
-
189
-
190
-
191
-
192
-
193
-
194
-
195
-
196
-
197
-
198
-
199
-
200
-
201
-
202
-
203
-
204
-
205
-
206
-
207
-
208
-
209
-
210
-
211
-
212
-
213
-
214
-
215
-
216
-
217
-
218
-
219
-
220
-
221
-
222
-
223
-
224
-
225
-
226
-
227
-
228
-
229
-
230
-
231
-
232
-
233
-
234
-
235
-
236
-
237
-
238
-
239
-
240
-
241
-
242
-
243
-
244
-
245
-
246
-
247
-
248
-
249
-
250
-
251
-
252
-
253
-
254
-
255
-
256
-
257
-
258
-
259
-
260
-
261
-
262
-
263
-
264
-
265
-
266
-
267
-
268
-
269
-
270
-
271
-
272
-
273
-
274
-
275
-
276
-
277
-
278
-
279
-
280
-
281
-
282
-
283
-
284
-
285
-
286
-
287
-
288
-
289
-
290
-
291
-
292
-
293
-
294
-
295
-
296
-
297
-
298
-
299
-
300
-
301
-
302
-
303
-
304
-
305
-
306
-
307
-
308
-
309
-
310
-
311
-
312
-
313
-
314
-
315
-
316
-
317
-
318
-
319
-
320
-
321
-
322
-
323
-
324
-
325
-
326
-
327
-
328
-
329
-
330
-
331
-
332
-
333
-
334
-
335
-
336
-
337
-
338
-
339
-
340
-
341
-
342
-
343
-
344
-
345
-
346
-
347
-
348
-
349
-
350
-
351
-
352
-
353
-
354
-
355
-
356
-
357
-
358
-
359
-
360
-
361
-
362
-
363
-
364
-
365
-
366
-
367
-
368
-
369
-
370
-
371
-
372
-
373
-
374
-
375
-
376
-
377
-
378
-
379
-
380
-
381
-
382
-
383
-
384
-
385
-
386
-
387
-
388
-
389
-
390
-
391
-
392
-
393
-
394
-
395
-
396
 |
 |

143
Overview Operating & Financial Review Governance Financial Statements Shareholder Information
scenarios designed to model combinations of both
Group-specific and market-wide liquidity crises, in
which the rate and timing of deposit withdrawals and
drawdowns on committed lending facilities are
varied, and the ability to access interbank funding
and term debt markets and to generate funds from
asset portfolios is restricted. The scenarios are
modelled by all our banking entities and by HSBC
Finance. The appropriateness of the assumptions
under each scenario is regularly reviewed. In
addition to our standard projected cash flow
scenarios, individual entities are required to design
their own scenarios to reflect specific local market
conditions, products and funding bases.
Limits for cumulative net cash flows under
stress scenarios are set for each banking entity and
for HSBC Finance. Both ratio and cash flow limits
reflect the local market place, the diversity of
funding sources available and the concentration risk
from large depositors. Compliance with entity level
limits is monitored centrally by Group Finance and
reported regularly to the Risk Management Meeting.
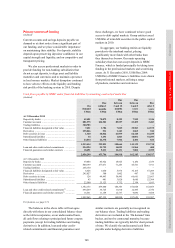
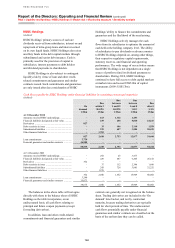
HSBC Finance
As HSBC Finance is unable to accept standard
retail customer deposits, it takes funding from the
professional markets. HSBC Finance uses a range
of measures to monitor funding risk, including
projected cash flow scenario analysis and caps
placed on the amount of unsecured term funding that
can mature in any rolling three-month and rolling
12-month periods. HSBC Finance also maintains
access to committed sources of secured funding and
has in place committed backstop lines for short-term
refinancing commercial paper (‘CP’) programmes.
A CP programme is a short-term, unsecured funding
tool used to manage day to day cash flow needs. In
agreement with the rating agencies, issuance under
this programme will not exceed 100% of committed
bank backstop lines.
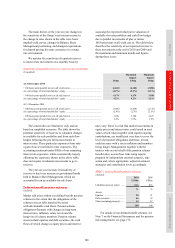
The need for HSBC Finance to refinance
maturing term funding is mitigated by the continued
run-down of its balance sheet.
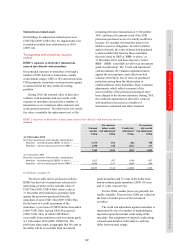
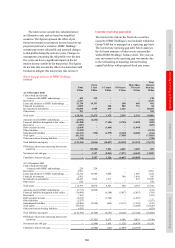
HSBC Finance – funding
(Audited)
At 31 December
2010 2009
US$bn US$bn
Maximum amounts of unsecured term
funding maturing in any rolling:
– 3 month period ....................... 5.1 5.2
– 12 month period ..................... 10.8 12.3
Unused committed sources of secured
funding57 ......................................... 0.5 0.4
Committed backstop lines from
non-Group entities in support of
CP programmes .............................. 4.3 5.3
For footnote, see page 174.
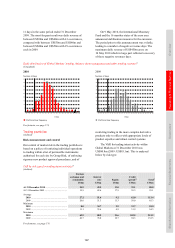
Contingent liquidity risk
(Audited)
In the normal course of business, we provide
customers with committed facilities, including
committed backstop lines to conduit vehicles
sponsored by HSBC and standby facilities to
corporate customers. These facilities increase our
funding requirements when customers choose to
raise drawdown levels over and above their normal
utilisation rates. The liquidity risk consequences of
increased levels of drawdown are analysed in the
form of projected cash flows under different stress
scenarios. The Risk Management Meeting also sets
limits for non-cancellable contingent funding
commitments by Group entity after due
consideration of each entity’s ability to fund them.
The limits are split according to the borrower, the
liquidity of the underlying assets and the size of the
committed line.
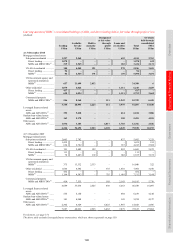
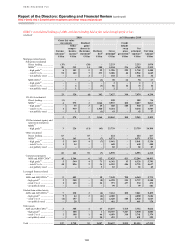
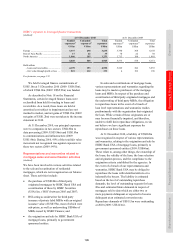
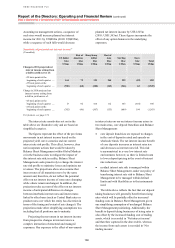
The Group’s contractual exposures at 31 December monitored under the contingent liquidity risk limit structure
(Audited)
HSBC Bank HSBC Bank USA HSBC Bank Canada
The Hongkong and
Shanghai Banking
Corporation
2010 2009 2010 2009 2010 2009 2010 2009
US$bn US$bn US$bn US$bn US$bn US$bn US$bn US$bn
Conduits
Client-originated assets58 ........
– total lines ......................... 7.8 7.4 4.0 6.4 0.2 0.3 – 0.3
– largest individual lines .... 0.7 0.8 0.4 0.4 0.1 0.1 – 0.3
HSBC-managed assets59 ......... 25.6 29.1 – – – – – –
Other conduits60 ...................... – – 1.4 1.3 – – – –
Single-issuer liquidity facilities
Five largest61 ........................... 4.2 4.3 5.3 6.1 2.0 2.0 1.4 1.2
Largest market sector62 ........... 8.4 7.9 4.9 4.7 3.8 2.9 2.4 1.5
For footnotes, see page 174.