HSBC 2010 Annual Report Download - page 325
Download and view the complete annual report
Please find page 325 of the 2010 HSBC annual report below. You can navigate through the pages in the report by either clicking on the pages listed below, or by using the keyword search tool below to find specific information within the annual report.-
 1
1 -
2
-
3
-
4
-
5
-
6
-
7
-
8
-
9
-
10
-
11
-
12
-
13
-
14
-
15
-
16
-
17
-
18
-
19
-
20
-
21
-
22
-
23
-
24
-
25
-
26
-
27
-
28
-
29
-
30
-
31
-
32
-
33
-
34
-
35
-
36
-
37
-
38
-
39
-
40
-
41
-
42
-
43
-
44
-
45
-
46
-
47
-
48
-
49
-
50
-
51
-
52
-
53
-
54
-
55
-
56
-
57
-
58
-
59
-
60
-
61
-
62
-
63
-
64
-
65
-
66
-
67
-
68
-
69
-
70
-
71
-
72
-
73
-
74
-
75
-
76
-
77
-
78
-
79
-
80
-
81
-
82
-
83
-
84
-
85
-
86
-
87
-
88
-
89
-
90
-
91
-
92
-
93
-
94
-
95
-
96
-
97
-
98
-
99
-
100
-
101
-
102
-
103
-
104
-
105
-
106
-
107
-
108
-
109
-
110
-
111
-
112
-
113
-
114
-
115
-
116
-
117
-
118
-
119
-
120
-
121
-
122
-
123
-
124
-
125
-
126
-
127
-
128
-
129
-
130
-
131
-
132
-
133
-
134
-
135
-
136
-
137
-
138
-
139
-
140
-
141
-
142
-
143
-
144
-
145
-
146
-
147
-
148
-
149
-
150
-
151
-
152
-
153
-
154
-
155
-
156
-
157
-
158
-
159
-
160
-
161
-
162
-
163
-
164
-
165
-
166
-
167
-
168
-
169
-
170
-
171
-
172
-
173
-
174
-
175
-
176
-
177
-
178
-
179
-
180
-
181
-
182
-
183
-
184
-
185
-
186
-
187
-
188
-
189
-
190
-
191
-
192
-
193
-
194
-
195
-
196
-
197
-
198
-
199
-
200
-
201
-
202
-
203
-
204
-
205
-
206
-
207
-
208
-
209
-
210
-
211
-
212
-
213
-
214
-
215
-
216
-
217
-
218
-
219
-
220
-
221
-
222
-
223
-
224
-
225
-
226
-
227
-
228
-
229
-
230
-
231
-
232
-
233
-
234
-
235
-
236
-
237
-
238
-
239
-
240
-
241
-
242
-
243
-
244
-
245
-
246
-
247
-
248
-
249
-
250
-
251
-
252
-
253
-
254
-
255
-
256
-
257
-
258
-
259
-
260
-
261
-
262
-
263
-
264
-
265
-
266
-
267
-
268
-
269
-
270
-
271
-
272
-
273
-
274
-
275
-
276
-
277
-
278
-
279
-
280
-
281
-
282
-
283
-
284
-
285
-
286
-
287
-
288
-
289
-
290
-
291
-
292
-
293
-
294
-
295
-
296
-
297
-
298
-
299
-
300
-
301
-
302
-
303
-
304
-
305
-
306
-
307
-
308
-
309
-
310
-
311
-
312
-
313
-
314
-
 315
315 -
 316
316 -
 317
317 -
 318
318 -
 319
319 -
 320
320 -
 321
321 -
 322
322 -
 323
323 -
 324
324 -
 325
325 -
 326
326 -
 327
327 -
 328
328 -
 329
329 -
 330
330 -
 331
331 -
 332
332 -
 333
333 -
 334
334 -
 335
335 -
336
-
337
-
338
-
339
-
340
-
341
-
342
-
343
-
344
-
345
-
346
-
347
-
348
-
349
-
350
-
351
-
352
-
353
-
354
-
355
-
356
-
357
-
358
-
359
-
360
-
361
-
362
-
363
-
364
-
365
-
366
-
367
-
368
-
369
-
370
-
371
-
372
-
373
-
374
-
375
-
376
-
377
-
378
-
379
-
380
-
381
-
382
-
383
-
384
-
385
-
386
-
387
-
388
-
389
-
390
-
391
-
392
-
393
-
394
-
395
-
396
 |
 |

323
Overview Operating & Financial Review Governance Financial Statements Shareholder Information
Derivatives are financial instruments that derive their value from the price of underlying items such as equities,
bonds, interest rates, foreign exchange, credit spreads, commodities and equity or other indices. Derivatives enable
users to increase, reduce or alter exposure to credit or market risks. HSBC makes markets in derivatives for its
customers and uses derivatives to manage its exposure to credit and market risks.
Derivatives are carried at fair value and shown in the balance sheet as separate totals of assets and liabilities. A
description of how the fair value of derivatives is derived is set out on page 313. Derivative assets and liabilities on
different transactions are only set off if the transactions are with the same counterparty, a legal right of set-off exists
and the cash flows are intended to be settled on a net basis.
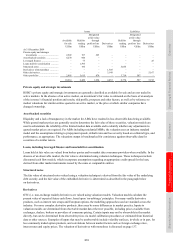
Use of derivatives
HSBC transacts derivatives for three primary purposes: to create risk management solutions for clients, to manage the
portfolio risks arising from client business and to manage and hedge HSBC’s own risks. Derivatives (except for
derivatives which are designated as effective hedging instruments as defined in IAS 39) are held for trading. The held
for trading classification includes two types of derivatives: those used in sales and trading activities, and those used
for risk management purposes but which for various reasons do not meet the qualifying criteria for hedge accounting.
The second category includes derivatives managed in conjunction with financial instruments designated at fair value.
These activities are described more fully below.
HSBC’s derivative activities give rise to significant open positions in portfolios of derivatives. These positions are
managed constantly to ensure that they remain within acceptable risk levels, with matching deals being utilised to
achieve this where necessary. When entering into derivative transactions, HSBC employs the same credit risk
management procedures to assess and approve potential credit exposures that are used for traditional lending.
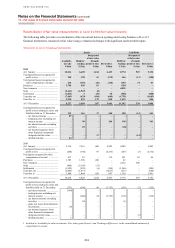
Trading derivatives
Most of HSBC’s derivative transactions relate to sales and trading activities. Sales activities include the structuring
and marketing of derivative products to customers to enable them to take, transfer, modify or reduce current or
expected risks. Trading activities in derivatives are entered into principally for the purpose of generating profits from
short-term fluctuations in price or margin. Positions may be traded actively or be held over a period of time to benefit
from expected changes in exchange rates, interest rates, equity prices or other market parameters. Trading includes
market-making, positioning and arbitrage activities. Market-making entails quoting bid and offer prices to other
market participants for the purpose of generating revenues based on spread and volume; positioning means managing
market risk positions in the expectation of benefiting from favourable movements in prices, rates or indices; arbitrage
involves identifying and profiting from price differentials between markets and products.
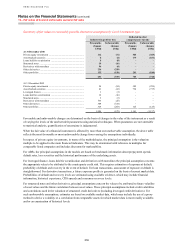
As mentioned above, other derivatives classified as held for trading include non-qualifying hedging derivatives,
ineffective hedging derivatives and the components of hedging derivatives that are excluded from assessing hedge
effectiveness. Non-qualifying hedging derivatives are entered into for risk management purposes but do not meet the
criteria for hedge accounting. These include derivatives managed in conjunction with financial instruments
designated at fair value.
Gains and losses from changes in the fair value of derivatives, including the contractual interest, that do not qualify
for hedge accounting are reported in ‘Net trading income’, except for derivatives managed in conjunction with
financial instruments designated at fair value, where gains and losses are reported in ‘Net income from financial
instruments designated at fair value’, together with the gains and losses on the economically hedged items. Where the
derivatives are managed with debt securities in issue, the contractual interest is shown in ‘interest expense’ together
with the interest payable on the issued debt. Substantially all of HSBC Holdings’ derivatives entered into with HSBC
undertakings are managed in conjunction with financial liabilities designated at fair value.
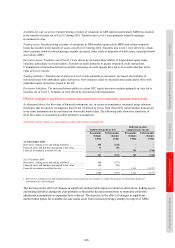
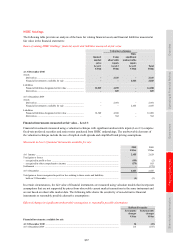
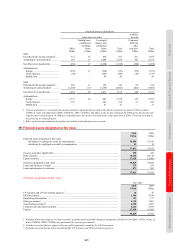
The notional contract amounts of derivatives held for trading purposes indicate the nominal value of transactions
outstanding at the balance sheet date; they do not represent amounts at risk. The 27% increase in the notional
amounts of HSBC’s derivative assets during 2010 was primarily driven by an increase in the number of open
interest rate contracts, reflecting increased trading volumes in the period.