HSBC 2010 Annual Report Download - page 80
Download and view the complete annual report
Please find page 80 of the 2010 HSBC annual report below. You can navigate through the pages in the report by either clicking on the pages listed below, or by using the keyword search tool below to find specific information within the annual report.-
 1
1 -
2
-
3
-
4
-
5
-
6
-
7
-
8
-
9
-
10
-
11
-
12
-
13
-
14
-
15
-
16
-
17
-
18
-
19
-
20
-
21
-
22
-
23
-
24
-
25
-
26
-
27
-
28
-
29
-
30
-
31
-
32
-
33
-
34
-
35
-
36
-
37
-
38
-
39
-
40
-
41
-
42
-
43
-
44
-
45
-
46
-
47
-
48
-
49
-
50
-
51
-
52
-
53
-
54
-
55
-
56
-
57
-
58
-
59
-
60
-
61
-
62
-
63
-
64
-
65
-
66
-
67
-
68
-
69
-
 70
70 -
 71
71 -
 72
72 -
 73
73 -
 74
74 -
 75
75 -
 76
76 -
 77
77 -
 78
78 -
 79
79 -
 80
80 -
 81
81 -
 82
82 -
 83
83 -
 84
84 -
 85
85 -
 86
86 -
 87
87 -
 88
88 -
 89
89 -
 90
90 -
91
-
92
-
93
-
94
-
95
-
96
-
97
-
98
-
99
-
100
-
101
-
102
-
103
-
104
-
105
-
106
-
107
-
108
-
109
-
110
-
111
-
112
-
113
-
114
-
115
-
116
-
117
-
118
-
119
-
120
-
121
-
122
-
123
-
124
-
125
-
126
-
127
-
128
-
129
-
130
-
131
-
132
-
133
-
134
-
135
-
136
-
137
-
138
-
139
-
140
-
141
-
142
-
143
-
144
-
145
-
146
-
147
-
148
-
149
-
150
-
151
-
152
-
153
-
154
-
155
-
156
-
157
-
158
-
159
-
160
-
161
-
162
-
163
-
164
-
165
-
166
-
167
-
168
-
169
-
170
-
171
-
172
-
173
-
174
-
175
-
176
-
177
-
178
-
179
-
180
-
181
-
182
-
183
-
184
-
185
-
186
-
187
-
188
-
189
-
190
-
191
-
192
-
193
-
194
-
195
-
196
-
197
-
198
-
199
-
200
-
201
-
202
-
203
-
204
-
205
-
206
-
207
-
208
-
209
-
210
-
211
-
212
-
213
-
214
-
215
-
216
-
217
-
218
-
219
-
220
-
221
-
222
-
223
-
224
-
225
-
226
-
227
-
228
-
229
-
230
-
231
-
232
-
233
-
234
-
235
-
236
-
237
-
238
-
239
-
240
-
241
-
242
-
243
-
244
-
245
-
246
-
247
-
248
-
249
-
250
-
251
-
252
-
253
-
254
-
255
-
256
-
257
-
258
-
259
-
260
-
261
-
262
-
263
-
264
-
265
-
266
-
267
-
268
-
269
-
270
-
271
-
272
-
273
-
274
-
275
-
276
-
277
-
278
-
279
-
280
-
281
-
282
-
283
-
284
-
285
-
286
-
287
-
288
-
289
-
290
-
291
-
292
-
293
-
294
-
295
-
296
-
297
-
298
-
299
-
300
-
301
-
302
-
303
-
304
-
305
-
306
-
307
-
308
-
309
-
310
-
311
-
312
-
313
-
314
-
315
-
316
-
317
-
318
-
319
-
320
-
321
-
322
-
323
-
324
-
325
-
326
-
327
-
328
-
329
-
330
-
331
-
332
-
333
-
334
-
335
-
336
-
337
-
338
-
339
-
340
-
341
-
342
-
343
-
344
-
345
-
346
-
347
-
348
-
349
-
350
-
351
-
352
-
353
-
354
-
355
-
356
-
357
-
358
-
359
-
360
-
361
-
362
-
363
-
364
-
365
-
366
-
367
-
368
-
369
-
370
-
371
-
372
-
373
-
374
-
375
-
376
-
377
-
378
-
379
-
380
-
381
-
382
-
383
-
384
-
385
-
386
-
387
-
388
-
389
-
390
-
391
-
392
-
393
-
394
-
395
-
396
 |
 |

HSBC HOLDINGS PLC
Report of the Directors: Operating and Financial Review (continued)
Geographical regions > Latin America
78
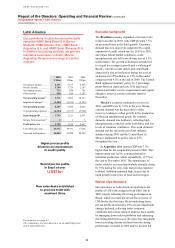
changes. In Mexico and Argentina, sales and
marketing initiatives supported by product and
channel enhancements resulted in an increase in
current and savings account balances. However,
the benefit was partly offset by tighter spreads on
customer accounts as a result of decreased market
interest rates in Mexico and Argentina.
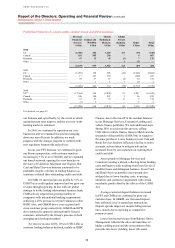
Fee income fell by 7% to US$1.7bn, driven by
lower transaction volumes in credit cards and
account services in Mexico and reduced account
services income in Brazil. Regulatory restrictions in
Brazil and Mexico also reduced the fees that could
be charged for certain banking services.
Net trading income of US$733m was 23% lower
than in 2009. A decline in market volatility which
resulted in fewer trading opportunities meant that the
strong performances in Foreign Exchange and Rates
in 2009 were not repeated.
Net income on financial instruments designated
at fair value declined by 21% to US$425m,
primarily due to lower investment returns
experienced on assets held in support of the pension-
linked portfolio in Brazil and annuity products in
Argentina. An offsetting decrease was recorded in
‘Net insurance claims incurred and movement in
liabilities to policyholders’.
Gains less losses from financial investments
declined by US$93m, largely because the gains on
the sale of Visa Inc. shares in 2009 did not recur.
Net earned insurance premiums increased
marginally to US$2.1bn, driven by improved
economic conditions which resulted in higher sales
of policies in Brazil and Argentina through the
branch network and a rise in premiums in Mexico.
This, combined with repricing initiatives in
Argentina and higher contributions in the pension-
linked product in Brazil from PFS and CMB
customers, resulted in increased premiums.
Net insurance claims incurred and movement in
liabilities to policyholders of US$1.8bn declined by
9%, mainly in pension-linked products in Brazil as
lower investment gains were allocated to
policyholders. This was partly offset by an increase
related to higher premiums in Argentina and Mexico.
Loan impairment charges and other credit risk
provisions declined by 44% in 2010 to US$1.5bn. In
PFS, the reduction in loan impairment charges
reflected a significant decline in the size of the credit
card portfolio in Mexico and an improvement in its
quality as a result of repositioning the portfolio
towards higher quality customers, tighter origination
criteria and improved collection practices. Loan
impairment charges also declined in Brazil,
primarily in consumer finance portfolios including
motor vehicle finance and payroll loans, as economic
conditions improved and these portfolios were
managed down. In CMB, loan impairment charges
fell, largely in Brazil, as improved economic
conditions and better credit quality resulted in lower
specific impairment charges, while in Mexico loan
impairment charges remained broadly unchanged.
Operating expenses increased by 10% to
US$6.4bn, driven largely by inflationary pressures
and investment in infrastructure and technology
projects across the region in support of improved
operational efficiency and business growth. Staff
costs increased in Brazil and Argentina due to
union-agreed wage increases, although this was
partly offset by a decline in average headcount as
costs continued to be managed carefully. Non-staff
expenditure also rose, driven mainly by higher
marketing and advertising costs in Brazil as we
positioned ourselves in this key growth market,
and transactional taxes increased as sales grew.