HSBC 2010 Annual Report Download - page 281
Download and view the complete annual report
Please find page 281 of the 2010 HSBC annual report below. You can navigate through the pages in the report by either clicking on the pages listed below, or by using the keyword search tool below to find specific information within the annual report.-
 1
1 -
2
-
3
-
4
-
5
-
6
-
7
-
8
-
9
-
10
-
11
-
12
-
13
-
14
-
15
-
16
-
17
-
18
-
19
-
20
-
21
-
22
-
23
-
24
-
25
-
26
-
27
-
28
-
29
-
30
-
31
-
32
-
33
-
34
-
35
-
36
-
37
-
38
-
39
-
40
-
41
-
42
-
43
-
44
-
45
-
46
-
47
-
48
-
49
-
50
-
51
-
52
-
53
-
54
-
55
-
56
-
57
-
58
-
59
-
60
-
61
-
62
-
63
-
64
-
65
-
66
-
67
-
68
-
69
-
70
-
71
-
72
-
73
-
74
-
75
-
76
-
77
-
78
-
79
-
80
-
81
-
82
-
83
-
84
-
85
-
86
-
87
-
88
-
89
-
90
-
91
-
92
-
93
-
94
-
95
-
96
-
97
-
98
-
99
-
100
-
101
-
102
-
103
-
104
-
105
-
106
-
107
-
108
-
109
-
110
-
111
-
112
-
113
-
114
-
115
-
116
-
117
-
118
-
119
-
120
-
121
-
122
-
123
-
124
-
125
-
126
-
127
-
128
-
129
-
130
-
131
-
132
-
133
-
134
-
135
-
136
-
137
-
138
-
139
-
140
-
141
-
142
-
143
-
144
-
145
-
146
-
147
-
148
-
149
-
150
-
151
-
152
-
153
-
154
-
155
-
156
-
157
-
158
-
159
-
160
-
161
-
162
-
163
-
164
-
165
-
166
-
167
-
168
-
169
-
170
-
171
-
172
-
173
-
174
-
175
-
176
-
177
-
178
-
179
-
180
-
181
-
182
-
183
-
184
-
185
-
186
-
187
-
188
-
189
-
190
-
191
-
192
-
193
-
194
-
195
-
196
-
197
-
198
-
199
-
200
-
201
-
202
-
203
-
204
-
205
-
206
-
207
-
208
-
209
-
210
-
211
-
212
-
213
-
214
-
215
-
216
-
217
-
218
-
219
-
220
-
221
-
222
-
223
-
224
-
225
-
226
-
227
-
228
-
229
-
230
-
231
-
232
-
233
-
234
-
235
-
236
-
237
-
238
-
239
-
240
-
241
-
242
-
243
-
244
-
245
-
246
-
247
-
248
-
249
-
250
-
251
-
252
-
253
-
254
-
255
-
256
-
257
-
258
-
259
-
260
-
261
-
262
-
263
-
264
-
265
-
266
-
267
-
268
-
269
-
270
-
 271
271 -
 272
272 -
 273
273 -
 274
274 -
 275
275 -
 276
276 -
 277
277 -
 278
278 -
 279
279 -
 280
280 -
 281
281 -
 282
282 -
 283
283 -
 284
284 -
 285
285 -
 286
286 -
 287
287 -
 288
288 -
 289
289 -
 290
290 -
 291
291 -
292
-
293
-
294
-
295
-
296
-
297
-
298
-
299
-
300
-
301
-
302
-
303
-
304
-
305
-
306
-
307
-
308
-
309
-
310
-
311
-
312
-
313
-
314
-
315
-
316
-
317
-
318
-
319
-
320
-
321
-
322
-
323
-
324
-
325
-
326
-
327
-
328
-
329
-
330
-
331
-
332
-
333
-
334
-
335
-
336
-
337
-
338
-
339
-
340
-
341
-
342
-
343
-
344
-
345
-
346
-
347
-
348
-
349
-
350
-
351
-
352
-
353
-
354
-
355
-
356
-
357
-
358
-
359
-
360
-
361
-
362
-
363
-
364
-
365
-
366
-
367
-
368
-
369
-
370
-
371
-
372
-
373
-
374
-
375
-
376
-
377
-
378
-
379
-
380
-
381
-
382
-
383
-
384
-
385
-
386
-
387
-
388
-
389
-
390
-
391
-
392
-
393
-
394
-
395
-
396
 |
 |

279
Overview Operating & Financial Review Governance Financial Statements Shareholder Information
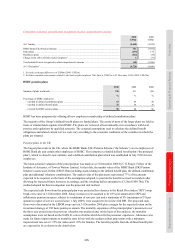
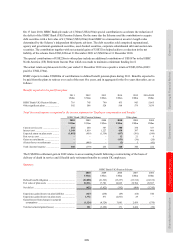
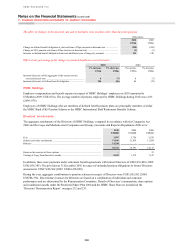
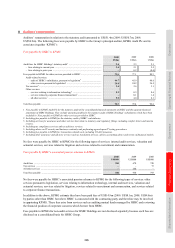
On 17 June 2010, HSBC Bank plc made a £1,760m (US$2,638m) special contribution to accelerate the reduction of
the deficit of the HSBC Bank (UK) Pension Scheme. On the same day the Scheme used the contribution to acquire
debt securities with a fair value of £1,760m (US$2,638m) from HSBC in a transaction at an arm’s length value
determined by the Scheme’s independent third-party advisors. The debt securities sold comprised supranational,
agency and government-guaranteed securities, asset-backed securities, corporate subordinated debt and auction rate
securities. The contribution together with net actuarial gains of US$321m helped achieve a reduction in the net
liability of the scheme from US$3,822m at 31 December 2009 to US$622m at 31 December 2010.
The special contributions of US$228m to other plans include an additional contribution of US$187m to the HSBC
North America (US) Retirement Income Plan which was made to maintain a minimum funding level.
The actual return on plan assets for the year ended 31 December 2010 was a positive return of US$3,695m (2009:
positive US$2,276m).
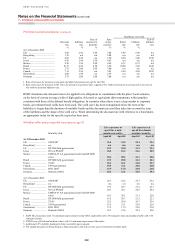
HSBC expects to make US$880m of contributions to defined benefit pension plans during 2011. Benefits expected to
be paid from the plans to retirees over each of the next five years, and in aggregate for the five years thereafter, are as
follows:
Benefits expected to be paid from plans
2011 2012 2013 2014 2015 2016-2020
US$m US$m US$m US$m US$m US$m
HSBC Bank (UK) Pension Scheme .. 716 745 790 835 903 5,665
Other significant plans ....................... 502 506 528 568 579 3,639
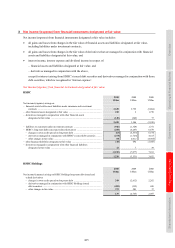
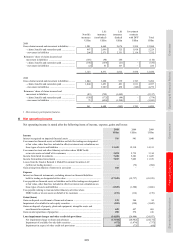
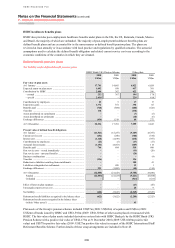
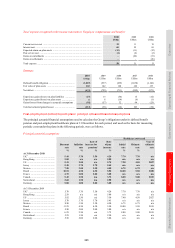
Total (income)/expense recognised in the income statement in ‘Employee compensation and benefits’
HSBC Bank (UK) Pension Scheme Other plans
2010 2009 2008 2010 2009 2008
US$m US$m US$m US$m US$m US$m
Current service cost ........................... 252 260 387 300 334 357
Interest cost ........................................ 1,148 1,019 1,227 438 397 466
Expected return on plan assets .......... (1,092) (959) (1,359) (437) (381) (549)
Past service cost ................................. – – – 12 21 9
Gains on curtailments ........................ – – – (151) (36) (20)
(Gains)/losses on settlements ............ – (499) – (2) 5 (41)
Total (income)/expense ..................... 308 (179) 255 160 340 222
The US$499m settlement gain in 2009 relates to an accounting benefit following a restructuring of the basis of
delivery of death in service and ill health early retirement benefits to certain UK employees.
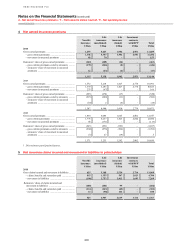
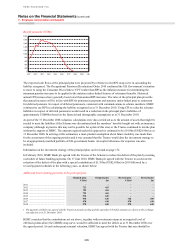
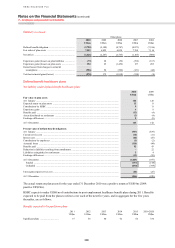
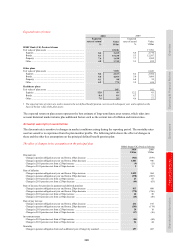
Summary
HSBC Bank (UK) Pension Scheme
2010 2009 2008 2007 2006
US$m US$m US$m US$m US$m
Defined benefit obligation ............................................ (22,858) (21,523) (15,257) (23,512) (24,332)
Fair value of plan assets ............................................... 22,236 17,701 14,865 22,704 20,587
Net deficit ..................................................................... (622) (3,822) (392) (808) (3,745)
Experience gains/(losses) on plan liabilities ................ (327) (234) (49) (64) 540
Experience gains/(losses) on plan assets ...................... 1,772 871 (2,861) 29 –
Gains/(losses) from changes in actuarial
assumptions .............................................................. (1,124) (4,329) 3,081 2,459 (570)
Total net actuarial gains/(losses) .................................. 321 (3,692) 171 2,424 (30)